NEW YORK (CNN/Money) - U.S. bond prices fell just before noon Thursday, sending yields higher as the combination of mortgage-related selling and worries about an improving economy continued to take its toll on the Treasury market.
The greenback was higher against the euro, but turned lower versus the yen after gaining ground during the morning.
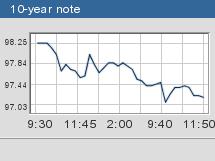
At around 11:50 a.m. ET, the benchmark 10-year note dropped another 11/32 to 97-5/32 of a point in price, yielding 4.60 percent, and the two-year note fell 3/32 to 99-9/32, yielding 1.87 percent, while the five-year note fell 7/32 of a point to 98-30/32, pushing the yield up to 3.48 percent.
The 30-year bond was an exception, rising 3/32 of a point to 99 even, as its yield fell to 5.44 percent.
Trading floor rumors attributed the 30-year bond's advance to Federal Reserve buying. However, traders told Reuters that the more likely explanation for the move down in 30-year yields was buying by Asian investors. The New York Fed declined to comment on speculation that the U.S. central bank was behind the move.
"If there's truth to the rumor that there is Asian buying in the long end, that would be it," a trader who wished to remain anonymous told Reuters. "But the market is thin and it doesn't take much in any period during the day to move it, especially when you get large flows coming through."
On Wednesday, the growing improvement in economic data came to a head following the surprisingly strong July retail sales. This was exacerbated in the aftermath of Tuesday's Fed development, in which the central bank kept rates steady at 1.0 percent, a 45-year low, but issued comparatively upbeat comments on the economy. Bond prices fell, and the 10-year note yield hit a new one-year high. Bond investors don't like an improving economy and higher interest rates because they tend to erode the value of long-term investments.
Bond investors also seemed to be demanding higher yields to better reflect the risks of growth and inflation, and that, in turn, was causing mortgage managers to unwind prepayment hedges by selling Treasurys.
This tendency continued Thursday, but was less pronounced, perhaps due to exhaustion after Wednesday's slide, or because the morning economic news was mostly in line.
Reports on weekly jobless claims, the trade deficit and producer prices were all released around 8:30 a.m. ET.
Weekly jobless claims remained below the 400,000 benchmark -- a level that signals economic weakness -- for the fourth week in a row. Claims rose to 398,000 last week from an upwardly revised 396,000 the previous week, a bit higher than expected.
The June trade deficit edged down to $39.55 billion from $41.48 billion in May, when economists expected it to inch higher. And the July producer price index, a measure of inflation at the wholesale level, remained well tamed at 0.1 percent, in line with estimates and below the 0.5 percent reported in June. Excluding food and energy, costs rose 0.2 percent, slightly above estimates.
Later this afternoon, the Federal Reserve releases the minutes from its late June meeting at which interest rates were cut a quarter-percentage point to the lowest level since the late 1950's. The Fed kept rates intact Tuesday, saying it saw signs of economic recovery.
The dollar had been fairly buoyant in the early going following the economic reports. It retained most of those gains in the afternoon, particularly versus the euro following weak gross domestic product growth data from Germany. However, the greenback gave back some of its gains versus the yen as the day wore on. At around 11:50 a.m. ET, the dollar bought ¥119.16, down from ¥119.25 late afternoon Tuesday, while the euro bought $1.1253, down from $1.1311 late Wednesday.

-- Reuters contributed to this report.
|