NEW YORK (CNN/Money) -
Tuesday's rally in stocks helped delay an unhappy market milestone that some technical market analysts say is coming anyway, sometime this year.
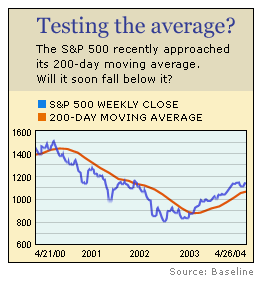
Late in March, the Dow Jones industrial average, the S&P 500 and the Nasdaq composite briefly approached their 200-day moving average, a closely watched indicator of market trends.
All have since recovered a bit, but they have remained closer to those averages than at any point since a rally began last year. And all have held at or below their shorter, 50-day, moving averages since then.
The day is coming, most likely later this year, when all will sink below their longer averages, some technical analysts say.
"Ultimately, the market will make a top, and then we will go below those averages," said Phil Roth, chief technical analyst at Miller Tabak & Co. "What we see going on is very normal at the end of a big advance."
Champagne corks popped when the major market indexes crossed above their 200-day moving averages in April 2003 -- it was a sign the bull market had staying power. When the opposite happens, it could be a sign the bears are back.
Like the Dow, the S&P flirted with its 200-day average in late 1999 through early 2000 before finally dropping below it in late 2000, where it stayed throughout the long bear market.
Though analysts aren't exactly calling for a repeat of those dark days, some believe it's likely that another period of underwater markets is on the way.
"We could be looking at the mirror image of what happened in April of last year, where we got above the 50-day and 200-day averages and then the trend turned up," said Richard Suttmeier, technical analyst and chief market strategist at Joseph Stevens in New York. "The risk of rolling the other way is the opposite [of that action]."
Other technical warning lights are also flashing yellow -- the number of stocks hitting new highs every day is shrinking, while the number of declining stocks has frequently edged the number of advancing stocks.
Though there may still be some upward momentum to stocks -- as evidenced by Tuesday's action, in which stocks rose on robust volume -- the longer-term trends are on the downside, some analysts say, thanks to rising interest rates.
"I've said we would make a cyclical top in the first half of 2004," said Roth of Miller Tabak. "It may not happen until the third quarter, but the ingredients are moving into place."
Other technical analysts simply see the recent sluggishness as part of a correction in a longer-term bear market. During such a correction, stock indices may touch their 200-day averages, but never fall totally below them.
"The correction is likely to go on for another month or two," said Ken Tower, chief market strategist at CyberTrader, "before there's really a compelling reason for investors and traders to move more money from the sidelines into the markets."

|