NEW YORK (CNN/Money) -
Living by the old Wall Street saw, "Sell in May, then walk away," isn't always the wisest way to manage your portfolio -- but this year, the adage might prove to be true.
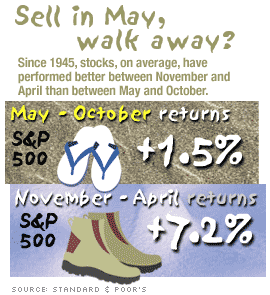
Since May 1945, on average, stocks in the S&P 500 have gained some 7.2 percent between the months of November and April, according to Standard & Poor's chief investment strategist Sam Stovall.
When the weather warms up, though, traders apparently head for the beach. Stocks have gained just 1.5 percent between the months of May and November. Thus the old saw.

Of course, like most old saws, it's sometimes not true. Last year, for example, stocks gained some 15 percent between May and October. In 1997, the S&P gained 14 percent in the same months. But Standard & Poor's says the November-April period has outperformed the May-October stretch 70 percent of the time.
And there are clearly sound reasons why stocks face seasonal headwinds this time of year and tailwinds in the winter, including big holiday bonuses, the April 15 deadline to invest in individual retirement accounts (IRAs), the fact that most pension and 401(k) contributions are made in January and the tendency of mutual funds to dump losing stocks before the end of their fiscal year in October.
What's more, unlike last year -- when the economy, corporate profits and stocks were bouncing back from the shock of the start of the Iraq war -- there are several fundamental reasons why stocks could fall this summer:
- Recent sterling gains in corporate earnings are likely to dull a bit, beginning in the second quarter, thanks to tougher comparisons with strong quarters a year ago.
- After a prolonged run-up starting about a year ago, stocks are already plenty expensive.
- Consumer spending growth could slow as the effects of tax cuts and a mortgage refinancing boom fade.
- Higher interest rates seem inevitably on their way, and that's not usually good news for stocks.
- All the while, geopolitical jitters and an intense presidential election campaign could keep uncertainty high and traders nervous.
"'Sell in May' very well may be the case this year," said James Awad, chairman of Awad Asset Management, which manages about $1.3 billion in money for individual and institutional investors.
"The best news is cresting right now," Awad said, "so it very well may be that we had a fabulous run in the market from March 2003 to January 2004, we've sort of marked time since then, and we'll roll over for the rest of the year until we get better visibility on 2005."
Getting defensive
Of course, not all stocks will suffer. Some sectors will thrive, and Stovall at Standard & Poor's has identified two -- consumer staples and health care -- that have historically done well during the May-October doldrums.
Since May 1990, according to Stovall's research, those two sectors have outperformed the S&P 70 percent of the time. Their average gains through this period have been 6.1 percent for consumer staples and 7.1 percent for health -- not too shabby for a lousy stretch.
"An investor who was long the market from November to April, but then adopted a defensive approach by rotating into either the S&P Consumer Staples or Health Care sectors during May through October, would have found ... that the returns were well worth the effort," Stovall wrote in a recent note.
Though that strategy wouldn't have worked too well last year, Stovall said it could be the ticket in 2004.
"There's a lot more uncertainty now," Stovall told CNN/Money. "And we've had 18 months of price advances -- that could just be setting us up for a renewal of the defensiveness the market goes through during the May-Oct. period."
Sell in July? Don't sell at all?
Old saws also have their detractors, and this one is no different.
For example, John Bollinger, president and founder of Bollinger Capital Markets and inventor of the "Bollinger Bands" used in technical analysis, says traders are actually better off selling in July, rather than May. Most of the market's worst volatility comes in the July-Oct. period, Bollinger believes -- he just doesn't have a catchy rhyme to express that yet.
Sell in July, say bye-bye? Doesn't have quite the same ring.
Anyway, Bollinger also thinks there's a chance these seasonal patterns will not be as pronounced this year -- the last two years of a president's term are often less seasonally volatile, according to his research, meaning gains can take place, regardless of the time of year.
"Typically, in the year of an election, 'Sell in May and go away' doesn't hold very well," Bollinger said.
In any event, if the economy can continue growing strongly without generating much inflation -- that's a great, big, fat "if" at this point, given recent inflation data -- then the Fed would likely take its time raising interest rates, and corporate profits would continue to grow strongly. That doesn't sound like a great time to be selling stocks.
"Our general feeling is that we will see continued moderate advances in equity prices, with earnings being the driving force, offsetting potential increases in short-term interest rates," said Robert Balentine, CEO of Balentine & Co., an investment consulting unit of Wilmington Trust (WL: Research, Estimates).
"I would think the adage of going away in May probably won't hold this year," Balentine said.

|

