NEW YORK (CNN/Money) - Death and taxes.
Could a third certainty be that the Dow will post a nice gain in 2005?
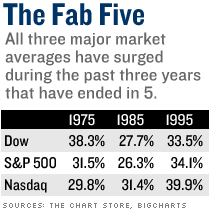
You'd think so if you look at research from The Chart Store, which shows that the Dow has soared in every year ending in a 5. The average gain for those years is a whopping 31.6 percent.
The only time the Dow failed to register a double-digit percentage rise was way back in 1895, with a mere 1.7 percent increase.
The phenomenon isn't limited to the Dow either. The S&P 500 shot up an average of 30.6 percent in 1975, 1985 and 1995 while the Nasdaq soared an average of 33.7 percent.
So does this mean that investors should bank on an up year next year? Of course not.
"It's interesting data to look at. Would I bet the farm on the pattern? No. But the point is that when these cycles do show up, they're worth paying attention to," said Ron Griess, president of the Chart Store.
Presidential politics causing lively fives?
Ed Clissold, senior global analyst with Ned Davis Research, a stock market research firm, said there is no economic explanation for the increases.
After all, years ending in 5 haven't been uniformly good for the economy. The United States was in the midst of the Great Depression in 1935 but was in a post-war boom in 1945 and 1955.
In 1975, crippling inflation helped send the United States into recession while 1985 was widely recognized as a time of low inflation and economic prosperity.
Still, the market did well in all of those years. In fact, the Dow enjoyed greater gains in 1935 and 1975 than it did in 1945, 1955 or 1985.
So what explains the winning streak?
One theory has to do with the political cycle.
J. Taylor Brown, vice president of the Hirsch Organization, which publishes the Stock Trader's Almanac, said that the markets usually do well in the year leading up to a presidential election. So that is a possible reason for the Dow's strength in 1895, 1915, 1935, 1955, 1975 and 1995.
Brown added that the year after a presidential election is also typically a strong one for stocks when the sitting president retained control of the White House. That's what happened in 1904, 1924, 1944, 1964 and 1984.
And it happened again this year.
"Don't invest just because a year ends in 5. That's silly. What's more important is that this is a post-election year and when the party in power maintains control it tends to be a good year for Wall Street," said Brown.
Unlucky sevens and crazy eights
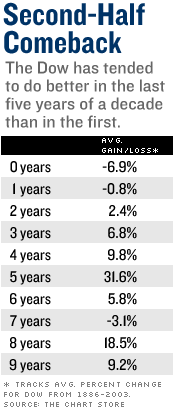
Still, politics can't really be the only reason behind the strong 5's. After all, years ending in 8 were also solid ones for the markets, according to the Chart Store, with the Dow gaining an average of 18.5 percent. And years ending in 8 are never years that precede or follow a presidential election year.
| More odd market indicators
|

|
|
|
|
In addition, years ending in 7 have not been kind to investors, even though they are either a year before or a year after a presidential election. The Dow has lost an average of 3.1 percent in years ending in 7.
Brown said another possible explanation for 5 years is more of a psychological one, namely that the middle of the decade tends to be more stable as investors have become accustomed to the decade as opposed to looking back to the previous one.
The numbers do bear out this argument. Years ending in 0 and 1 have both been losing ones for the Dow, which could reflect investor uncertainty about the new decade while years ending in 3, 4, and 6 have seen the Dow rise, on average, 7.5 percent.
Still, when push comes to shove, the fact that the market has enjoyed strong 5 years is probably just be another bizarre statistical quirk, kind of like the Super Bowl indicator.
According to that "rule", the stock market should go up when an original NFL team wins the Super Bowl and go down when an old AFL team wins the Super Bowl.
The New England Patriots, an old AFL team, won this year. Yet, the S&P 500 and Nasdaq are currently sitting on year-to-date gains with about a month left on the calendar. The Dow is down slightly.
It just goes to show that there's no sure thing on Wall Street.
"When dealing with the stock market over time, nothing is going to be fool proof," said Clissold.

|