|
A little softness at home
Realtors say existing home sales, while still historically strong, at the slowest pace in almost two years.
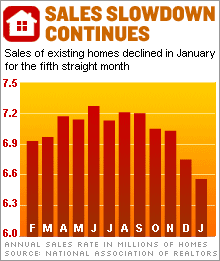
NEW YORK (CNNMoney.com) - The pace of home sales slowed slightly in January, according to a trade group report Tuesday that showed a growing softness in the closely watched real estate market. The National Association of Realtors reported that existing homes sold at an annual rate of 6.56 million in January, compared with the revised 6.75 million pace posted for December. Economists surveyed by Briefing.com had forecast that the sales rate would stay the at 6.6 million pace originally reported for December.
The January report was the slowest pace of sales of existing homes since February 2004, and it's down nearly 10 percent from the record pace set in June 2005. It also marked the fifth straight month of slower home sales. But while the pace is down from the white-hot sales of the last two years, it is still strong by historical standards. As recently as 2003, sales of 6.18 million existing home during the year established what was then a record. The January report showed an increase in the inventory of homes available for sale, as well as the month's supply of new homes. There were 2.9 million homes available for sale at the end of January, up 2.4 percent from December and up nearly 36 percent from January 2005. The group estimates the current supply of homes represents a 5.3 month supply, compared to an average of a 4.5 month supply through all of 2005. Both those increases were also present in the new home sales report from the Census Bureau Monday, and suggested that there could be a glut of homes on the market in some regions. Jeoff Hall, the chief U.S. economist for Thomson Financial, who doesn't see the recent run-up in real estate sales and prices as a "bubble" that could pop, nevertheless believes there will be downward pressure on prices going forward. "I do think there's an oversupply of homes on the market, both new and existing. Demographics suggest as well that supply and demand will tilt to more oversupply," he said. "I think it is a buyer's market now and it will be even more of a buyers' market six months from now." Realtors President Thomas Stevens disputed Hall's view about a buyer's market, arguing that the increased inventory is merely alleviating what had been an overly tight supply. "We see the momentum of double-digit (percentage) appreciation being sustained in home prices," he said in his statement. "Even when home sales slow, they still supply solid returns." Sale prices were unchanged in January compared to December, with an average sales price of $261,000 and a median home price of $211,000. A median price is the level at which half the homes sell for more and half sell for less. The January price readings reflected an 8.3 percent gain compared to a year earlier in average home price, and a 11.6 percent rise in median home price over that time. But the Realtors' report acknowledges the latest reading is another sign of cooling in the real estate market. "In the wake of interest rates peaking in November, I expect we are in a bit of a trough that may be followed by a modest rise and then a general plateau in the level of sales activity," said David Lereah, the Realtors' chief economist, in the group's statement. "Existing-home sales should stay below the record levels experienced over the last two years, but they'll maintain a historically high pace." The group reported existing home sales of 7.08 million homes in 2005, up from 6.78 million existing homes in 2004. __________________ For a look at whether there is a glut of new homes for sale, click here. Click here to see if you are you better off selling your house through an auction rather than a traditional listing.
For more on the real estate market and what it means for you and the economy, click here. |
|


