Yields throw the Fed a curve
10-year Treasury yield slips below fed funds rate for first time since last recession, sparking debate about economy, Fed rate policy.
NEW YORK (CNNMoney.com) - Three of the scariest words in economics used to be "inverted yield curve." The condition, which occurs when long-term interest rates are lower than short-term rates in the Treasury bond market, was once seen as a pretty clear signal of a recession ahead.
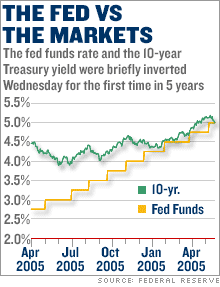
And while that's changed - many economists now say an inversion is more a sign of a slowing economy than a coming recession - the action in the bond market Wednesday morning had some experts saying the Federal Reserve may finally be forced to pause in its rate-hiking campaign so as not to upset financial markets. "It's not among the top five things they're reading, but I don't think they're ignoring it totally," said Tom Schlesinger, executive director Financial Markets Center, a research firm that follows the Fed closely. The inversion early Wednesday was different than the inversion that occurred late last year and early this year, when the 10-year Treasury yield fell below the yield on shorter-term Treasury securities. Wednesday's inversion came as the 10-year yield fell briefly below the fed funds rate, the Fed's short-term rate target, currently 5 percent. It was the first time that's happened since April 2001, the last time the country was in a recession. The 10-year yield dipped briefly below the fed funds rate Wednesday morning after a report showed a big drop in demand in April for cars, refrigerators and other big-ticket items known as durable goods. But when a report on new home sales came in above forecasts 90 minutes later, the 10-year Treasury yield edged back above the 5 percent level. "Ever since the Fed said decisions on future rate hikes would be data dependant, all of a sudden all the numbers matter," said Kevin Giddis, managing director of fixed income at Morgan Keegan. And even if Fed officials have downplayed the threat of an inverted curve, some economists said the Fed will be reluctant to get too far ahead of where bond investors are betting rates will go. Last winter, the Fed could keep raising rates without pushing the fed funds rate past the 10-year yield. But in recent comments, Fed Chairman Ben Bernanke repeated the view expressed by his predecessor Alan Greenspan that an inverted yield curve is no longer a good indicator of a recession ahead. "In previous episodes when an inverted yield curve was followed by recession, the level of interest rates was quite high, consistent with considerable financial restraint," Bernanke said in a speech in March. "This time, both short- and long-term interest rates -- in nominal and real terms -- are relatively low by historical standards." Ian McCulley, analyst with Grant's Interest Rate Observer, a financial newsletter, said he doesn't think the Fed will feel constrained by the recent moves in the bond market. "The curve (between the 3-month and 10-year) was inverted or flat earlier this year and they tightened into that," he said. The narrow gap between long-term and short-term rates is something Greenspan famously referred to as a conundrum, and the flat or inverted yield curve seen Wednesday is just the latest example of that puzzle, experts said. Even if there was more of a gap until recently, it was still narrow by historic standards, said Schlesinger. "I'm not sure how much the conundrum ever went away," he said. It's also true that the inversion Wednesday was short-lived and relatively narrow. Some of the pre-recession inversions in the past were far more pronounced. For example the gap between the 10-year yield and the fed funds rate were inverted for nearly 11 months and the gap reached 1.5 percentage points in January 2001, just before the Fed started cutting rates. The recession that started in late 2000 lasted until the fall of 2001. Still, an inverted yield curve is not something that can be ignored, the experts said. "I think it would be healthy to be concerned, given the track record of the curve being a warning sign," said Schlesinger. "It's important not to be trapped by past patterns. But it (the inverted yield curve) does raise a question about how far the Fed has to tighten." Giddis and Schlesinger both said they're skeptical that an inverted yield curve now will mean a recession later this year More likely? It's signaling slower economic growth ahead. And maybe an end to Fed rate hikes sooner rather than later. -------------------------- For the latest news from the bond markets, click here.
For a special report, "Eyes on the Fed," click here. |
| |||||||||||||||||


