|
Stocks: 5 years after 9/11 The worst terrorist attack on U.S. soil changed many things around the world. Wall Street's one of them. NEW YORK (CNNMoney.com) -- Five years after the worst terrorist attack in U.S. history, a lot has changed in the world. And a few things have changed on Wall Street too. Yes, the stock market has recovered from the lows hit after the attacks, which came not long after the end of the business boom of the late 1990s. But beyond the numbers, there have been plenty of other interesting shifts.
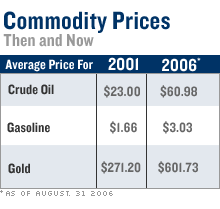
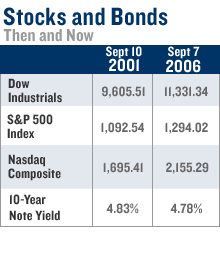
"I think there is a greater recognition now that economies and markets are globally tied together," said William Hummer, principal at money manager Wayne Hummer Inc. "There is a better understanding that what happens in China and Europe affects the United States." In addition, corporate balance sheets are in much better shape than they were five years ago, said Ram Kolluri, chief investment officer at GlobalValue Investors. "Companies have refinanced their debt and increased their cash flow," he said, noting Corporate America may be better able to weather the slower economic growth expected over the next year or two. The corporate governance landscape has also changed after the wave of scandals at Enron, WorldCom, Tyco (Charts), HealthSouth (Charts) and Adelphia. "Corporate executives will have to think twice before trying to pull a WorldCom on investors again," Kolluri said. But mostly, the five years since 9/11 have made investors a little bit tougher. The 'terror premium' The ability of terrorism to roil U.S. financial markets seems to have dwindled, with stocks nowadays showing a milder response. Some analysts say the threat of a terrorist attack is already priced into the stock market. But maybe the milder response has been because of the simple fact that there hasn't been another attack in the United States since 9/11. Financial markets never opened on Sept. 11, 2001, and remained closed for the next four trading sessions. When stocks began trading again on Sept. 17, the results were predictably gloomy. The Dow Jones industrial average plunged 684.71 points, its biggest one-day point loss in history. The following spring, on May 20, 2002, stocks slumped as investors reacted to fighting in the Middle East, and to comments from Vice President Dick Cheney that the likelihood of another terrorist attack against the U.S. is "almost certain," and "not a matter of if, but when." Stocks also fell May 21, 2002, after the FBI warned that New York authorities should be prepared for potential attacks against city landmarks such as the Brooklyn Bridge. But by the following day, stocks were back on the rise. Compare that to the reaction of the markets on Sept. 10, 2002, when the Department of Homeland Security raised the threat level for the first time, amid what it said was the possibility of violence timed to coincide with the first anniversary of 9/11. The threat level was raised from "yellow," or "elevated," at the point it began when it was introduced six months earlier, to "orange" or "high." The news was announced in the afternoon, and briefly caused stocks to give back their gains, but all three major gauges recovered soon after and ended modestly higher for the session. Stocks saw slim declines the next day. The stock market response was similar after the attacks in July 2005 on Britain's transit system that killed 52 people and wounded some 700 others. Both U.S. and European markets initially sold off, but both managed to recover by the end of the session. And just last month, stocks ended higher on Aug. 10 after an initial selloff on reports that British authorities had foiled a plot to blow up commercial airplanes flying between the United Kingdom and the United States. The Iraq effect Similarly, the ability of developments in the war in Iraq to move markets has lessened. Stocks initially slumped but ultimately closed higher on March 20, 2003, the first full day of military action in the U.S.-led war against Iraq. Stocks rallied the following day, a Friday, on hopes the war would be over fairly quickly. But by Monday investors realized that wasn't likely and the Dow saw its worst one-day selloff in six months. But over the next few months, stocks rallied as investors focused on the economic recovery, eventually making 2003 the first year of gains for the market since 1999. Since then, financial markets have mostly only reacted to the ongoing war in Iraq and other instances of global violence when it has seemed to threaten to drive up the price of oil. Oil, gas and gold Fluctuating prices in the oil, gas and gold markets were factors in trading in 2001, but didn't seem to drive day-to-day market action. That's certainly changed, with the price of oil, and to a lesser extent, gasoline and gold, often driving stocks on Wall Street. Why? For one thing, all three commodities have skyrocketed since 9/11, amid higher global demand for oil and gasoline, and in the case of gold as a hedge against inflation. U.S. light crude ended at about $21 a barrel in September 2001 and averaged about $23 that year, according to the government. This year, oil hit a record closing high of $77.03 a barrel on July 14 and is now at about $66 a barrel. As of the end of August, the average price this year was about $61 a barrel, according to the Department of Energy. In 2001, gas prices averaged $1.66 a gallon, adjusted for inflation, but that's up to $3.03 this year, through the end of last month, an 83 percent increase. Then there's gold. On Sept. 10, 2001, gold ended at $271.60, according to the New York Mercantile Exchange, near its average for the year. Now gold's near $625, a jump of about 130 percent. Interest rates and the economy In 2001, the Federal Reserve was in the middle of an interest-rate cutting campaign, trying to pull the economy out of recession after the implosion of the late 1990s. The summer of 2001 was brutal for stocks and for corporate America, with many companies issuing profit warnings and cutting jobs. On Aug. 21, 2001, the Fed cut its fed funds rate - a key short-term bank lending rate - by another quarter-percentage point to 3.50 percent. It was the seventh cut of the year, including one that had been made in between the Fed's regularly scheduled policy meetings. The Fed - then led by Chairman Alan Greenspan - had pushed the fed funds rate as high as 6.50 percent by May 2000 in a bid to slow the then-booming economy. Rates were held steady until January 2001, when Greenspan & Co. began cutting them. They would lower rates 6 more times through June of 2003, ultimately leaving the fed funds rate at 1 percent, helping corporations and the stock market to recover. June 2004 brought the first rate hike in the current cycle. The Fed raised rates 17 straight times before pausing last month. Most economists think the bankers will hold rates steady at the next meeting on Sept. 20, though more rate hikes could be on tap beyond that. Meanwhile, market watchers are split as to whether the economy is heading for a slowdown or a recession, particularly as inflationary pressures aren't yet waning, as the Fed had predicted. In the bond market, the benchmark ten-year note is currently yielding 4.78 percent, versus a yield of 4.83 percent in Sept. 2001. But short-term yields are higher. Currently, the 2-year note is yielding 4.81 percent, versus 3.52 percent on Sept. 10, 2001. But back in 2001, the yield curve was not inverted as it is now. An inverted curve happens when the yield on short-term Treasurys is higher than that of longer-dated securities, an aberration that usually spells an economic slowdown - and has also predated recession. Bulls vs Bears Right now, stocks are near the end of what many consider to be a nearly 4-year-old bull market. But in the fall of 2001, stocks were in the middle of what would become a 3-year bear market. Stocks had an enormous run at the end of the 1990s that peaked in the first quarter of 2000. And the comedown from the huge runup was brutal. 2000 was one of the worst years for the stock market, with the Nasdaq posting its biggest one-year loss on a percentage basis since its inception in 1971. The Dow recorded its biggest one-year percentage loss since 1981 and the S&P 500 index saw its biggest one-year drop since 1977. A rough 2001 got worse after the attacks in September, but the market was already hurting before that. By the close of trade on Sept. 10, 2001, the Nasdaq had fallen 31 percent on the year, the Dow industrials had fallen 11 percent and the S&P 500 index had fallen 17 percent. The market bottomed in October of 2002, leading to the current bull market. But the bull seems to be tiring. So far this year, the Dow is up 5.7 percent and the S&P 500 is up 3.7 percent but the Nasdaq composite is down 2.3 percent. |
|


