|
What's next for stocks A big rally gave the S&P 500 its best 3rd quarter in 9 years and pushed the Dow near record highs. Can investors keep it going? NEW YORK (CNNMoney.com) -- What happened? The stock market was supposed to be all bad in the third quarter. Terribly bad for the bulls. Wonderfully bad for the bears. But the S&P 500 rose just short of 5 percent in the third quarter, while the Dow gained 4.5 percent. The Nasdaq gained 3.8 percent.
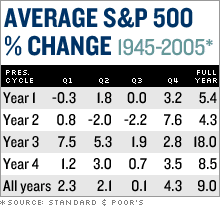
The third quarter is usually the worst of the year. And this year it was supposed to be especially bad since 2006 is a mid-term election year, and third quarters in those years tend to be the worst of the worst (see chart at right). The rally has put the S&P 500 at another 5-1/2-year high and pushed the Dow near its record close set in January 2000, at the end of the 1990s boom. How did all this happen? And what's next for the market? "A good third quarter in any year is unusual and one in a mid-term election year is even more unusual," said Jeffrey Hirsch, editor of Stock Trader's Almanac. "But there's no historical record of what it means for the fourth quarter." That's a period that typically starts out weak on Wall Street but often ends up with a year-end "Santa Claus" rally. But will the showing so far this year, do the bulls need a rest? Hirsch said the market is getting a boost this week from classic end-of-quarter moves by money managers who want to buy up winners before closing their books on the quarter. "When the quarter ends or even after the mid-term elections and all the heavy buying ends, we could still see a pullback," he said, noting the tendency for stocks to slip in early October, but then rally through the end of the year. There are many reasons the market has been doing well. The economy's still growing, although more slowly than in recent quarters, and corporate profits remain robust. The economy and earnings have held up even after a two-year rate hiking campaign from the Federal Reserve, which is now apparently on hold. Then there's the steep decline in oil and gas prices that have taken the edge off inflation worries and put more money into the hands of consumers. On the other side of the ledger: The bull market, at nearly four years old, is ancient compared to other bull runs. Plus the economy is slowing, sharply, though it is still growing. Plus the housing market is eroding. Yet, stocks are doing well. Year-to-date, the S&P 500 is up 7.3 percent, the Dow is up 9.4 percent and the Nasdaq composite is up 2.6 percent. The strength has surprised investors and even some seasoned market professionals. Like other market historians, Standard & Poor's chief strategist Sam Stovall thought the third quarter would be a weak one. "My feeling was, here we are in a mid-term election year and we haven't had a 10-plus percent bull market correction," he said. Both Stovall and Hirsch said the second-quarter decline of 7.7 percent on the S&P 500 could have been the sell-off for this year, although it would be light compared to other mid-term election year dips. Now what? Just like in May, the Dow is currently nearing its record closing high and the S&P 500 is at a 5-1/2 year peak. Still, the Nasdaq remains buried 55 percent off its high hit in March 2000, when the Internet bubble peaked. From such lofty heights, could stocks be primed to slump through the rest of the year? That doesn't seem likely, most analysts said, but there are risks. Investors seem to be back in a "Goldilocks" market, betting that growth is not too hot, not too cold, but just right, said Tom Schrader, managing director of listed trading at Legg Mason. "The economy is slowing, but not too much, and commodity prices are coming in, which means more money in consumer pockets going back to retail," Schrader said. Stovall said one worry is that if oil prices - which have already bounced off of recent lows - rear back up too much in October, that could spark a stock selloff. But the other side of that, Schrader said, "is that if oil prices drop too hard, that could signal that the economy is slowing more than people think, and then you would have recession fears again," he said, referring to the fact that the huge surge in oil prices over the last six years is a reflection of a booming global economy. (Click here for more on the economic outlook.) A slower economy would hurt corporate profits, drive up price-to-earnings ratios, which would then make stocks seem less attractively valued. In fact, earnings disappointments are probably the biggest threat as investors move into October and third-quarter reports start rolling in. "The risk is that with the economy set to slow, there will be downward revisions to company earnings for the rest of the year and going into 2007," said Alan Gayle, senior investment strategist at Trusco Capital Management. Stovall said he thinks the market has a good shot at rallying in the fourth quarter, which is statistically the best quarter overall in the four-year presidential cycle, with S&P 500 gains averaging 7.6 percent going back to 1945. But he's worried about earnings, too, noting that profit forecasts are too optimistic if the economy is going to slow to about a 2 percent growth rate next year from an expected 3.5 percent in 2006. On Thursday, second-quarter gross domestic product growth was revised down to a slower-than-expected 2.6 percent rate. And on Wednesday, a monthly read showed a surprise slip in August durable goods orders. But the market barely noticed either report, a sign investors are not yet factoring in the impact of a slowing economy on stocks. ---------------------------------------------------------------------------------- |
|


