Big comeback for stocks, but ...Stocks had their best day in months just a week after the big selloff. But that doesn't mean the roller coaster is over.NEW YORK (CNNMoney.com) -- Great! The rally is back on. Pfew. It was looking a little shaky there for awhile. But if history is to be trusted - and sometimes it's not - the rally is not necessarily back on. Or even if it is, it may not be the same following last week's global selloff. 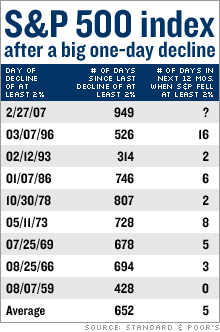 
Stocks crumbled last Tuesday - posting their worst one-day decline since the market reopened after Sept. 11, 2001. The selloff - initially sparked by a big decline in China's stock market and a sharp drop in U.S. durable goods orders - dragged the S&P 500 index down 2 percent. It was the first one-day decline of at least 2 percent in 949 days, according to Standard & Poor's chief strategist Sam Stovall. That was the longest stretch without a 2 percent drop since the 1950s, underscoring the longevity and consistency of the bull market, which turned 4 last October. Stovall's research also shows that in recent history, when a period of relative calm was abruptly disturbed - like what happened last week - the year that followed was a lot more volatile than the one before. He looked back to 1950 for periods that the S&P 500 went at least 12 months without dropping 2 percent in a day. What he found was that once the trend was broken, the S&P 500 sank at least 2 percent an average of five times over the next 12 months. Recent history is even worse. After the calm stretch that ended in March 1996, the S&P 500 fell at least 2 percent 16 times in the next 12 months. (See chart for details). Stovall's research also showed that trading volume usually rose and prices swung more widely in the 12 months after a 2 percent S&P drop. All of this made the markets a lot more volatile for investors. But it didn't necessarily mean stocks were lower 12 months after the more than 2 percent decline. After the March 1996 decline, despite seeing an extremely volatile 12 months, the S&P 500 emerged 23 percent higher. Granted, that was the rah rah boom of the late '90s. How about in less exuberant eras? After a February 1993 selloff, despite a volatile 12 months, the S&P 500 emerged 5.5 percent higher. After the January 1986 decline, the S&P 500 emerged 19.4 percent higher. After the Oct. 1978 decline, despite a volatile 12 months, the S&P 500 emerged 8 percent higher. So will the S&P 500 be higher 12 months from now? Probably. But that's no sure thing. What's going against the rally this time is the relative old age of this current bull market. At nearly 4-1/2 years old, this is the fifth oldest bull since 1900, according to the Stock Trader's Almanac. The 1986 decline and comeback happened when that bull market was younger than the current one. The 1978 decline and comeback happened in the middle of what historians consider to be a bear market. But after the 1993 decline and comeback, that bull market went on to last through July 1998, and is considered to be the longest running bull market in history, according to the Almanac. So maybe this 4-1/2 year old can last a bit longer. Yet, in addition to age, this bull is looking long in the tooth in terms of gains. Between Oct. 9, 2002 - which many traders call the bottom after the three-year bear market - and Feb. 26, 2007, the day before the big selloff, the S&P 500 jumped 86 percent. Bull markets since 1900 have seen the S&P 500 gain 78.1 percent, on average, according to the Almanac. So either this 4-1/2 year old advance is winding down, or its going to make a run at cracking the top 4 all-time longest bull markets. Either way, it's going to get a lot choppier from here on out. |
|