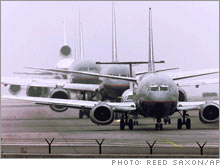
Tarmac delays common, government saysLatest figures show about 600 flights per month stuck on taxiways for at least two hours; JetBlue had good record prior to February crisis.NEW YORK (CNNMoney.com) -- Nearly 600 flights had to wait on the tarmac two hours or more before departing in January, nearly twice what was seen a year ago but roughly in line with a typical month, according to the latest Transportation Department statistics. The problem of passengers stranded on planes that have already left the gate got a great deal of attention recently, when many JetBlue (Charts) passengers were stuck on the tarmac at John F. Kennedy International Airport for eight hours or more on Feb. 14 due to a storm hitting the area.
JetBlue has since conceded it handled the weather problems badly and introduced a customer bill of rights for its customers to address the problems, including the chance to get off any flight delayed on the ground five or more hours and vouchers good for future flights for any ground delay more than 30 minutes. An industrywide passenger bill of rights has been introduced in Congress as well. One provision of the legislation would allow passengers to deplane after three hours on the tarmac. The 588 flights in January that waited two hours or more on the taxiways represented a rate of 9.5 flights out of every 10,000. There were 134 flights that were delayed on the tarmac for three or more hours, or about two for every 10,000 flights. In January 2006 there were only 298 flights with tarmac delays of two hours or more, or only 5.1 such delays per 10,000 flights. But that was a month of particularly mild weather which produced the warmest January on record. The delays seen in January 2007 was not an unusual number of delays. In 2006 the DOT reported there were 7,405 delays of two or more hours, or an average of 617 a month, or a rate of 10.4 such delays per 10,000 flights. And the problem of passengers stuck in planes on the tarmac might actually be worse than the numbers suggest, since it only includes planes that took off, not flights that pushed back from the gate but were eventually cancelled. JetBlue had a record of relatively few long tarmac delays in January before February's service meltdown. In January it had only five flights with a delay of two to three hours, and one additional flight with a delay of three to four hours. That works out to fewer than four flights out of every 10,000 with a delay of two or more hours, a big improvement from the average of nearly 19 such delays per 10,000 flights in 2006. Of the major carriers, Continental (Charts) had the highest percentage of flights waiting two hours or more on taxiways in January and as well throughout 2006, with 54 such delays in January, or 20.7 per 10,000 flights. The January performance was better than its 2006 record, when it had 795 such delays, or 25.7 for every 10,000 flights. Of all airlines measured by the DOT, ExpressJet (Charts), which flies as the feeder airline Continental Express, had the worst record in January and essentially tied its former parent Continental for the worst record in 2006. Its 98 such delays in January were the most in the industry, and represented nearly 28 such delays per 10,000 flights. ExpressJet also had the two of the longest delays in January, both at George Bush Intercontinental Airport in Houston on Jan. 16. There was a five-hour, 52-minute delay on the tarmac on a flight to Richmond and a five-hour, 26-minute delay on a flight to Phoenix. Continental also had a five-hour, 12-minute delay that day on a flight from Houston to Portland, Ore., while the next day AirTran (Charts) had a five-hour, 27-minute delay on the tarmac at Dallas-Fort Worth on a flight to Orlando. American Airlines (Charts), the nation's largest airline, had the largest number of such delays in 2006, posting 1,206 such delays. That works out to nearly 19 such delays per 10,000 flights. The Air Transport Association, the trade group for the nation's largest airlines, issued a statement last month saying recent delays should serve to emphasize the emerging crisis of capacity in our nation's air traffic control system. It called for aggressive steps to modernize that system. It has said it would oppose legislation spelling out any passenger bill of rights. "One thing we all want to avoid is the imposition of inflexible government standards, which could unintentionally result in greater customer inconvenience," said ATA President James May in a recent Op-Ed piece in USA Today. |
Sponsors
|

