Home price slump helps spur salesHome sales jumped 3.9% last month, best gain since '04, but the gains came as sellers cut prices, even before subprime woes hit.NEW YORK (CNNMoney.com) -- Sales of existing homes posted the biggest jump in nearly three years in February, though sellers got the gains the way Detroit automakers spur sales - by cutting prices. The National Association of Realtors said Friday that home sales rose 3.9 percent last month to an annual rate of 6.7 million from a revised 6.4 million pace in January. It was the biggest percentage increase since March 2004.

Mortgage Rates
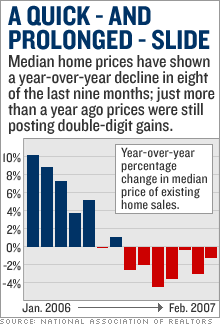
Economists surveyed by Briefing.com had looked for a slowdown to a 6.3 million pace. But even though sales rose from January, the pace was still down 3.6 percent from February 2006. But the report also showed the median price of a home sold in February fell 1.3 percent to $212,800 from a year earlier. That was the seventh straight month that prices fell from a year earlier. While home prices can swing widely from month to month, a drop in prices from a year earlier is relatively rare - and is sign of how weak the housing market has become. Before the current price weakness started in mid-2006, it had been 11 years since prices showed a drop compared to a year earlier. And while the year-over-year decline may seem modest, it is 7.6 percent below the record high hit just last July. Half the homes sell for more than the median and half sell for less. "The analogy to the auto industry is a good one. Why did we sell more houses? Because we lowered the price," said Michael Strauss, chief economist at Common Fund, a money management firm serving not-for-profit clients. The strong sales pace was also helped by one of the warmer Decembers on record. Sales of existing homes are recorded after closing, not when a sales contract is signed, usually a month or two before the closing date. The report is also a snapshot of the market before the recent problems with subprime mortgages started to curtail financing - and the number of buyers on the market. The problems with subprime loans made to buyers with weak credit began surfacing in late February and accelerated in March. "The housing sales data we got today is history," said Bill Hampel, chief economist Credit Union National Association. "The news on the subprime has all come since these contracts were signed." Hampel said the reaction of the markets and regulators to the problems in subprime mortgages means that many buyers will no longer be able to qualify to borrow as they could as late as last year to buy a home, which will continue to push down prices and sales going forward. A rise in home foreclosures will also add to the glut of homes on the market, which will mean more downward pressure on prices. "All of this points to a softer housing market than we otherwise would have expected," said Hampel. The Realtors said they're hopeful that prices could start to turn around later this year. Pat Vredevoogd Combs, a Grand Rapids, Mich., Realtor who is president of the trade group, said the weakness in pricing should help bring in buyers who had been priced out of the market during the white-hot boom years. "Overall, home prices should rise slowly this year, and many buyers have an opportunity now that was only a dream during the five-year boom," she said in the group's statement. But Strauss agreed with Hampel about continued weakness. He said the most important number is the large supply of homes for sale - a number that showed growing weakness despite stronger sales. There were 3.7 million homes for sale last month, up nearly 6 percent from the 3.5 million in January, and up by a quarter from a year earlier. "Inventories went up even more than sales went up," he said. "There is an inventory overhang that we've got to clear out to bring money back into the sector." The glut is due largely to overbuilding during the record housing boom of 2005 and early 2006. Thursday, KB Home (Charts), the No. 5 U.S. home builder, reported earnings plunged 84 percent and warned that higher foreclosures and tighter lending standards in the broader market could prolong weakness in the sector. The CEO of D.R. Horton (Charts), the No. 1 U.S. builder, told an investor conference earlier this month that prices and new home sales in 2007 are "going to suck." Earlier this month, New Jersey builder Hovnanian Enterprises (Charts) became the latest to report a loss following shortfalls at Pulte Home (Charts) and Centex (Charts). Even builders still reporting earnings, such as D.R. Horton and Toll Brothers (Charts), have reported sharply lower income. |
Sponsors
|

