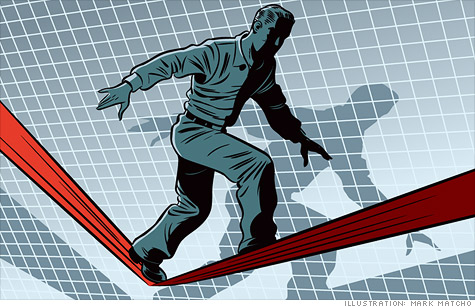
For insight on stocks, it pays to keep an eye on a few key credit spreads. Right now they're signaling trouble ahead.
FORTUNE -- With the economy wobbling, what's the best way to tell whether the stock market is headed for a complete meltdown or poised for a roaring rally? Simple: Watch the spreads. No, not the latest lines from Vegas oddsmakers. Rather, experts point to three key metrics in the credit markets that have historically given investors a good sense of the risk environment ahead.
Start with the so-called TED spread, which measures the difference between the rates on three-month U.S. Treasury bills and the three-month London interbank offered rate, or Libor (the rate at which banks borrow from one another). The wider it is, the more skittish banks are about lending. Right now, the TED spread is telling investors to "tread lightly in stocks," warns Gina Martin Adams, an equity strategist at Wells Fargo Securities.
The TED spread has more than doubled since Jan. 1 and now hovers around 40 basis points (100 basis points equals one percentage point). That's a far cry from the 400-plus basis points reached during the 2008 financial crisis, but it's still a troubling trend. Wells Fargo's Adams points out that even as the S&P 500 (SPX) index was soaring more than 11% during early October, the TED spread continued to widen. That kind of divergence is "usually a warning sign worth noting," she says. "Credit markets have not confirmed the positive tone of equities."
Another gap worth watching is the difference between the yields on 10-year U.S. government bonds and high-yield (junk) bonds. It reflects the premium that investors demand for taking on the extra risk of default, and it has widened significantly of late. The spread between the Bank of America Merrill Lynch U.S. High Yield Master II index and 10-year Treasuries hit 7.6 percentage points in late October, well above the historical average of around six points. That indicates that bond investors are anticipating a rise in defaults.
Finally, keep an eye on the spreads for credit default swaps (CDS), contracts that insure a buyer of debt against the possibility of default. The spread represents the annual cost paid by the buyer of the credit protection; the higher the spread, the more skeptical the market is of the debtor's ability to repay.
Monitoring the heavily traded CDS market for sovereign debt is a good way to gauge the prospects of struggling European economies, says William Mast, director of fixed-income indexes for Morningstar. As of late October, for example, France's five-year CDS spread stood at 1.9 percentage points, meaning it costs an average of $190,000 a year to insure $10 million of debt. That's almost double the cost investors paid for that same protection in January, a reflection of the mounting worries that the eurozone debt crisis could deteriorate into a full-blown economic disaster.
Until spreads tighten again, it makes sense to stay cautious.
--A former compensation consultant, Janice Revell has been writing about personal finance since 2000.
This article is from the November 7, 2011 issue of Fortune. ![]()

Carlos Rodriguez is trying to rid himself of $15,000 in credit card debt, while paying his mortgage and saving for his son's college education.
Susan Carson and Laura DeLallo make $225,000 and have half a million in retirement savings, but their sprawling portfolios is proving hard to manage.
| Overnight Avg Rate | Latest | Change | Last Week |
|---|---|---|---|
| 30 yr fixed | 3.80% | 3.88% | |
| 15 yr fixed | 3.20% | 3.23% | |
| 5/1 ARM | 3.84% | 3.88% | |
| 30 yr refi | 3.82% | 3.93% | |
| 15 yr refi | 3.20% | 3.23% |
Today's featured rates:


