Search News

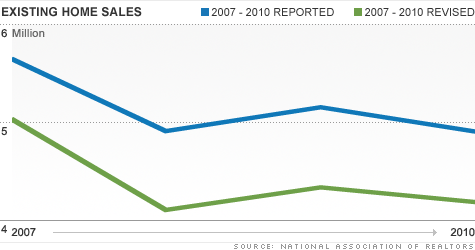
NEW YORK (CNNMoney) -- Existing home sales during the housing bust were actually 14.3% worse than previously reported, a revision to Realtors' group numbers shows.
On Wednesday, the National Association of Realtors (NAR) revised home sale counts back to 2007 due to flaws in their original data analysis.
In 2007, there were actually just 5.04 million existing home sales, 11% less than the 5.65 million originally reported. Even worse were 2008 and 2009, when there were 16% fewer sales than originally reported. Sales in 2010 were 15% lower.
"The errors started in 2007 and continued to accumulate over time," said Lawrence Yun, NAR's chief economist.
The accuracy of the data is important. Private companies like residential real estate developers rely on it for planning and policy makers make decisions based on it.
The data is "key to the economic outlook," said Mark Zandi of Moody's Analytics, "and the revisions help to explain the severity of the housing crash."
David Crowe, chief economist for the National Association of Home Builders, said its members use existing home sales as reported by NAR as a gauge of the overall health of the housing market.
"Sales data and, just as important, an inventory buildup, would make builders less likely to go forward with developments," he said.
Some industry sources had been critical of the organization's data. In February, CoreLogic charged that NAR data was overestimating sales by 15% to 20%.
When NAR investigated, it found a "notable upward drift" in the numbers compared to other measurements such as courthouse deeds records, said Yun.
NAR doesn't report actual counts of home sales but estimates them based on the number of transactions reported by local Realtors.
That method worked well into the mid-2000s, but then discrepancies arose during the housing bust as Realtors started to get involved in more deals and some MLSs expanded into new territories, skewing the numbers and leading to doublecounting of some sales.
Still, the revisions, according to Zandi, will have little impact going forward and, looking backward, are of limited importance.
"We all knew it was a crash, now it's a deeper one," he said.
For November, the latest month under the re-benchmarked formula, sales of existing homes came in at a seasonally adjusted, annualized rate of 4.42 million. That's up 4% from the revised level of 4.25 million in October and 12.2% higher than a year earlier.
That good news followed recent positive reports on new home sales and home construction activity. These pickups, along with historically low mortgage rates, may indicate that "a modest recovery may be underway," said Paul Dales, a senior economist with Capital Economics. ![]()
| Overnight Avg Rate | Latest | Change | Last Week |
|---|---|---|---|
| 30 yr fixed | 3.80% | 3.88% | |
| 15 yr fixed | 3.20% | 3.23% | |
| 5/1 ARM | 3.84% | 3.88% | |
| 30 yr refi | 3.82% | 3.93% | |
| 15 yr refi | 3.20% | 3.23% |
Today's featured rates: