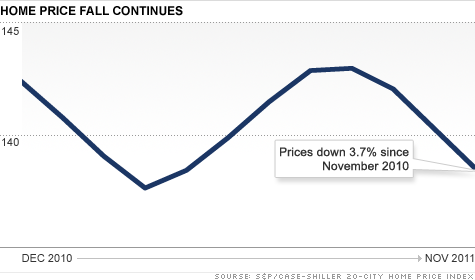
NEW YORK (CNNMoney) -- Home prices posted a steep, month-over-month drop in November, falling 1.3%, according to the latest S&P/Case-Shiller 20-city report. Prices fell in 19 of the 20 cities the index covers.
Prices are down 3.7% from a year ago, and off 32.8% since they peaked in the summer of 2006. The index is currently only 0.6% above its March, 2011 low.
"Despite continued low interest rates and better real GDP growth in the fourth quarter, home prices continue to fall," said David Blitzer, spokesman for S&P.
Phoenix, one of the hardest hit metro areas in the country, was the only place to record a gain in November. Prices there rose 0.6% month-over-month but are down 3.6% from a year ago.
Home prices in Chicago posted the steepest decline of any city on the index, falling 3.4% month-over-month. Atlanta prices were down 2.5% and Detroit prices fell 2.4%.
The drop in home prices was more than housing bear Peter Morici, professor at the University of Maryland Smith School of Business, anticipated. He had forecast a 0.8% drop.
"We've had more robust sales activity in the housing market lately," he said.
Morici thinks recent home price weakness stems at least partially from the fact that more sellers have accepted the weak market conditions and are putting their homes up for sale. Retirees and other home owners had postponed sales, trying to wait out the decline.
"Sooner or later, you have to get rid of that house," he said.
Pat Newport, a housing market analyst for IHS Global Insight, agrees that's part of the story.
"People are a lot more flexible on price than they were three years ago," he said. "They're willing to lower their asking prices to move their houses."
He thinks a bigger contributor to the market malaise is sales of properties in foreclosure. Many homes sold these days are either short sales or homes that were repossessed from mortgage borrowers who could not pay their loans.
"That probably explains the steep declines in Atlanta," said Newport. "That city has a large number of foreclosed properties."
Atlanta continues to be a standout for price drops. Its 2.5% November fall followed a 5% drop in October, a 5.9% plunge in September and a 2.4% slide in August. It also posted the weakest annual return, down 11.8%.
Other poor performers over the 12 months ended in November were Las Vegas, where prices were hard hit by foreclosure sales and fell 9.1%, and Seattle, which recorded a 6.3% decline. Detroit, up 3.8% and Washington, with a gain of 0.5%, were the only cities in positive territory for the past 12 months.
![]()
| Overnight Avg Rate | Latest | Change | Last Week |
|---|---|---|---|
| 30 yr fixed | 3.80% | 3.88% | |
| 15 yr fixed | 3.20% | 3.23% | |
| 5/1 ARM | 3.84% | 3.88% | |
| 30 yr refi | 3.82% | 3.93% | |
| 15 yr refi | 3.20% | 3.23% |
Today's featured rates: