Top companies: Most diverse
|
Top 100 Headquarters ...What Readers Say
Select benefits you want and see instantly which Best Companies offer them.
Find my top perks |
Find the right company for you
What qualities are you looking for in a great employer? Use our tool to find the companies on our list that suit you best.
Video
-
 DreamWorks Animation, No. 47 on Fortuneís Best Companies to Work For list, strives to create a paradise for artists. Watch
 -
The online retailer, No. 23 on Fortuneís Best Companies to Work For list, encourages employees to express themselves. Watch
-
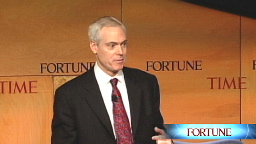
Author Jim Collins tells a Fortune conference that successful companies need to adapt, but remain consistent to their values. Watch
-
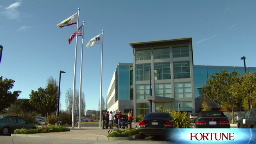
This data storage company believes happy people are more productive. No wonder it tops Fortuneís Best Companies to Work For list. Watch
-
Author Jim Collins tells a Fortune conference that companies that stick to their 'core values' are the ones with staying power. Watch
-
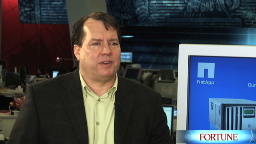
 David Hitz, founder of Net App, No. 1 on the list, says the key to problem solving is to enlist the help of somebody you trust. Watch
| Company | Avg. annual pay |
|---|---|
| Bingham McCutchen | $256,312 |
| Lehigh Valley Hospital & Health Network | $244,605 |
| Orrick Herrington & Sutcliffe | $240,955 |
| Company | Job growth % |
|---|---|
| Stanley | 65% |
| Rackspace Hosting | 59% |
| 40% |
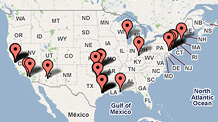
| State | No. of top employers |
|---|---|
| California | 15 |
| Texas | 14 |
| New York | 9 |
To choose the 100 Best, we conduct the most extensive employee survey in corporate America. More than 81,000 employees from 353 companies responded to a 57-question survey created by the Great Place to Work Institute. More

