2013
2012
2011
2010
2009
2008
2007
2006
1955-2005
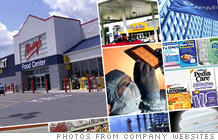
Our annual ranking of America's largest corporations
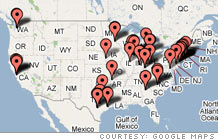
FORTUNE 500 Headquarters
Click to enlarge
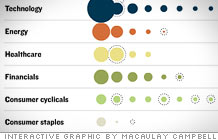
Show FORTUNE 500 Companies:
101
AMR
22,563.0
231.0
102
Abbott Laboratories
22,476.3
1,716.8
103
Plains All Amer. Pipeline
22,444.4
285.1
104
Nationwide
22,253.0
2,113.0
105
Weyerhaeuser
22,250.0
453.0
106
Lyondell Chemical
22,228.0
186.0
107
Publix Super Markets
21,819.7
1,097.2
108
McDonald's
21,586.4
3,544.2
109
Tech Data
21,446.1
-97.0
110
Humana
21,416.5
487.4
111
Electronic Data Systems
21,337.0
470.0
112
Northwestern Mutual
20,726.2
829.4
113
Wyeth
20,350.7
4,196.7
114
Goodyear Tire & Rubber
20,258.0
-330.0
115
Emerson Electric
20,133.0
1,845.0
116
J.C. Penney
19,903.0
1,153.0
117
Supervalu
19,863.6
206.2
118
Coca-Cola Enterprises
19,804.0
-1,143.0
119
Constellation Energy
19,446.1
936.4
120
UAL
19,340.0
22,876.0
121
Apple
19,315.0
1,989.0
122
AutoNation
19,314.4
316.9
123
U.S. Bancorp
19,109.0
4,751.0
124
Occidental Petroleum
19,029.0
4,182.0
125
Sara Lee
18,539.0
555.0
126
Staples
18,160.8
973.7
127
Whirlpool
18,080.0
433.0
128
Tesoro
18,002.0
801.0
129
Bristol-Myers Squibb
17,914.0
1,585.0
130
Lear
17,838.9
-707.5
131
Manpower
17,786.5
398.0
132
Express Scripts
17,660.0
474.4
133
TJX
17,516.4
738.0
134
Rite Aid
17,271.0
1,273.0
135
Loews
17,227.6
2,491.3
136
Delta Air Lines
17,171.0
-6,203.0
137
Kimberly-Clark
16,746.9
1,499.5
138
Bear Stearns
16,551.4
2,053.9
139
Cigna
16,547.0
1,155.0
140
Dominion Resources
16,524.0
1,380.0
141
Paccar
16,454.1
1,496.0
142
Lennar
16,266.7
593.9
143
Duke Energy
15,967.0
1,863.0
144
Gap
15,943.0
778.0
145
Xerox
15,895.0
1,210.0
146
Anheuser-Busch
15,717.1
1,965.2
147
United States Steel
15,715.0
1,374.0
148
FPL Group
15,710.0
1,281.0
149
Eli Lilly
15,691.0
2,662.7
150
Exelon
15,654.0
1,592.0
151
Union Pacific
15,578.0
1,606.0
152
Kohl's
15,544.2
1,108.7
153
Centex
15,465.1
1,289.3
154
Capital One Financial
15,191.0
2,414.5
155
D.R. Horton
15,051.3
1,233.3
156
Office Depot
15,010.8
516.1
157
Burlington No. Santa Fe
14,985.0
1,887.0
158
Nike
14,954.9
1,392.0
159
Progressive
14,786.4
1,647.5
160
DIRECTV Group
14,755.5
1,420.1
161
Nucor
14,751.3
1,757.7
162
Texas Instruments
14,630.0
4,341.0
163
Computer Sciences
14,623.6
634.0
164
AFLAC
14,616.0
1,483.0
165
CBS
14,479.1
1,660.5
166
CHS
14,383.8
490.3
167
Oracle
14,380.0
3,381.0
168
Southern
14,356.0
1,573.0
169
Murphy Oil
14,307.4
638.3
170
Pulte Homes
14,274.4
687.5
171
Amgen
14,268.0
2,950.0
172
Avnet
14,253.6
204.5
173
ConAgra Foods
14,171.9
533.8
174
Fluor
14,078.5
263.5
175
Illinois Tool Works
14,055.0
1,717.7
176
Chubb
14,003.0
2,528.0
177
Enterprise GP Holdings
13,991.0
99.5
178
Qwest Communications
13,923.0
593.0
179
Arrow Electronics
13,577.1
388.3
180
USAA
13,416.4
2,329.6
181
Waste Management
13,363.0
1,149.0
182
Eastman Kodak
13,274.0
-601.0
183
SunTrust Banks
13,260.4
2,117.5
184
Huntsman
13,148.2
229.8
185
TRW Automotive Holdings
13,144.0
176.0
186
Continental Airlines
13,128.0
343.0
187
Sun Microsystems
13,068.0
-864.0
188
National City Corp.
12,952.7
2,299.8
189
Health Net
12,908.4
329.3
190
Masco
12,833.0
488.0
191
Pepsi Bottling
12,730.0
522.0
192
American Electric Power
12,622.0
1,002.0
192
Edison International
12,622.0
1,181.0
194
Textron
12,591.0
601.0
195
Northwest Airlines
12,568.0
-2,835.0
196
PG&E Corp.
12,539.0
991.0
197
L-3 Communications
12,476.9
526.1
198
Eaton
12,370.0
950.0
199
Public Service Enterprise Group
12,288.0
739.0
200
Colgate-Palmolive
12,237.7
1,353.4
From the April 30th, 2007 issue
Most profitable companies
Fortune 500 methodology Included in the survey are U.S. incorporated companies filing financial statements with a government agency. This includes private companies... (more )