FORTUNE 500 Headquarters
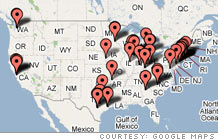
Click to enlarge
Show FORTUNE 500 Companies:
| 601 |
MasterCard
|
3,326.1 |
50.2 |
| 602 |
Abercrombie & Fitch
|
3,318.2 |
422.2 |
| 603 |
Trinity Industries
|
3,317.7 |
230.1 |
| 604 |
Del Monte Foods
|
3,308.6 |
169.9 |
| 605 |
St. Jude Medical
|
3,302.4 |
548.3 |
| 606 |
New Jersey Resources
|
3,299.6 |
78.5 |
| 607 |
Equity Office Properties
|
3,285.1 |
341.0 |
| 608 |
Ruddick
|
3,265.9 |
72.3 |
| 609 |
VWR International
|
3,257.6 |
68.7 |
| 610 |
SanDisk
|
3,257.5 |
198.9 |
| 611 |
General Growth Properties
|
3,256.3 |
59.3 |
| 612 |
Harman Intl. Industries
|
3,247.9 |
255.3 |
| 613 |
Building Materials Holding
|
3,245.2 |
102.1 |
| 614 |
Steel Dynamics
|
3,238.8 |
396.7 |
| 615 |
Lithia Motors
|
3,232.9 |
37.3 |
| 616 |
EGL
|
3,217.6 |
56.3 |
| 617 |
Alliant Techsystems
|
3,216.8 |
153.9 |
| 618 |
American Axle & Mfg.
|
3,191.7 |
-222.5 |
| 619 |
Legg Mason
|
3,190.9 |
1,144.2 |
| 620 |
Genzyme
|
3,187.0 |
-16.8 |
| 621 |
Swift Transportation
|
3,172.8 |
141.1 |
| 622 |
Mercury General
|
3,168.7 |
214.8 |
| 623 |
Pentair
|
3,154.5 |
183.7 |
| 624 |
Casey's General Stores
|
3,153.7 |
60.5 |
| 625 |
Olin
|
3,151.8 |
149.7 |
| 626 |
Hasbro
|
3,151.5 |
230.1 |
| 627 |
Crosstex Energy
|
3,141.8 |
16.5 |
| 628 |
JohnsonDiversey
|
3,134.4 |
118.3 |
| 629 |
Laidlaw International
|
3,131.9 |
124.9 |
| 630 |
Allegheny Energy
|
3,121.5 |
319.3 |
| 631 |
SkyWest
|
3,114.7 |
145.8 |
| 632 |
American National Ins.
|
3,114.4 |
273.2 |
| 633 |
Dick's Sporting Goods
|
3,114.2 |
112.6 |
| 634 |
Walter Industries
|
3,102.2 |
198.4 |
| 635 |
Country Insurance & Financial Services
|
3,101.3 |
190.9 |
| 636 |
Energizer Holdings
|
3,076.9 |
260.9 |
| 637 |
HealthSouth
|
3,076.6 |
-625.0 |
| 638 |
Unitrin
|
3,075.5 |
283.1 |
| 639 |
Republic Services
|
3,070.6 |
279.6 |
| 640 |
Nvidia
|
3,068.8 |
448.8 |
| 641 |
Brink's
|
3,067.6 |
587.2 |
| 642 |
Charming Shoppes
|
3,067.5 |
108.9 |
| 643 |
Thor Industries
|
3,066.3 |
172.5 |
| 644 |
Allergan
|
3,063.3 |
-127.4 |
| 645 |
Flowserve
|
3,061.1 |
115.0 |
| 646 |
Interstate Bakeries
|
3,060.5 |
-128.3 |
| 647 |
Puget Energy
|
3,044.3 |
219.2 |
| 648 |
Perini
|
3,042.8 |
41.5 |
| 649 |
Gilead Sciences
|
3,026.1 |
-1,190.0 |
| 650 |
Peoples Energy
|
3,018.0 |
-17.6 |
| 651 |
Retail Ventures
|
3,014.1 |
-186.1 |
| 652 |
RPM International
|
3,008.3 |
-76.2 |
| 653 |
Valspar
|
2,978.1 |
175.3 |
| 654 |
Granite Construction
|
2,969.6 |
80.5 |
| 655 |
Forest Laboratories
|
2,962.4 |
708.5 |
| 656 |
Nicor
|
2,960.0 |
128.3 |
| 657 |
Unified Western Grocers
|
2,953.8 |
16.1 |
| 658 |
Electronic Arts
|
2,951.0 |
236.0 |
| 659 |
Solutia
|
2,947.0 |
11.0 |
| 660 |
Noble Energy
|
2,940.1 |
678.4 |
| 661 |
Superior Essex
|
2,938.2 |
57.3 |
| 662 |
Manitowoc
|
2,933.3 |
166.2 |
| 663 |
Pactiv
|
2,917.0 |
274.0 |
| 664 |
Benchmark Electronics
|
2,907.3 |
111.7 |
| 665 |
Diebold
|
2,906.2 |
86.5 |
| 666 |
Worthington Industries
|
2,897.2 |
146.0 |
| 667 |
CUNA Mutual Group
|
2,891.9 |
169.4 |
| 668 |
Tower Automotive
|
2,884.4 |
-215.3 |
| 669 |
Commerce Bancorp
|
2,870.3 |
299.3 |
| 670 |
Steelcase
|
2,868.9 |
48.9 |
| 671 |
Airgas
|
2,862.3 |
123.6 |
| 672 |
Molex
|
2,861.3 |
237.0 |
| 673 |
Hewitt Associates
|
2,857.2 |
-115.9 |
| 674 |
Southern Union
|
2,853.1 |
64.1 |
| 675 |
Questar
|
2,835.6 |
444.1 |
| 676 |
Amerigroup
|
2,835.1 |
107.1 |
| 677 |
W.R. Grace
|
2,826.5 |
18.3 |
| 678 |
Sabre Holdings
|
2,823.8 |
155.6 |
| 679 |
Exide Technologies
|
2,819.9 |
-172.7 |
| 680 |
Linens Holding
|
2,819.3 |
-154.4 |
| 681 |
US Oncology Holdings
|
2,811.4 |
26.2 |
| 682 |
Payless Shoesource
|
2,797.5 |
122.0 |
| 683 |
American Eagle Outfitters
|
2,794.4 |
387.4 |
| 684 |
Convergys
|
2,789.8 |
166.2 |
| 685 |
Jack in the Box
|
2,765.6 |
108.0 |
| 686 |
Compass Bancshares
|
2,755.8 |
460.4 |
| 687 |
A.G. Edwards
|
2,750.8 |
238.3 |
| 688 |
Carlisle
|
2,748.8 |
215.7 |
| 689 |
Amkor Technology
|
2,728.6 |
170.1 |
| 690 |
UAP Holding
|
2,727.8 |
66.4 |
| 691 |
MBIA
|
2,723.2 |
819.3 |
| 692 |
McCormick
|
2,716.4 |
202.2 |
| 693 |
Vornado Realty Trust
|
2,714.6 |
560.1 |
| 694 |
ABM Industries
|
2,712.7 |
93.2 |
| 695 |
Seaboard
|
2,707.4 |
258.7 |
| 696 |
Scotts Miracle-Gro
|
2,697.1 |
132.7 |
| 697 |
Hospira
|
2,688.5 |
237.7 |
| 698 |
Biogen Idec
|
2,683.0 |
217.5 |
| 699 |
HNI
|
2,679.8 |
123.4 |
| 700 |
Protective Life
|
2,679.1 |
281.6 |
From the April 30th, 2007 issue
|
| Most profitable companies |
| Fortune 500 methodology |
| Included in the survey are U.S. incorporated companies filing financial statements with a government agency. This includes private companies... (more)
|
|