Find your top companies
 High revenue growth  High profit growth
 High EPS growth  High return to investors
 Top 5 in its industry  Best company to work for
 Big employer  Small employer


Video
  • NEXT
    Wal-Mart by the numbers
    A look inside the retail giant, the No. 1 company on the Fortune 500 list - from salaries to its biggest-selling product. Watch
  • NEXT
    BACK
    Customize a Dreamliner
    Boeing, No. 27 on the Fortune 500, relies on thousands of workers around the globe to manufacture each unique 787. Watch
  • NEXT
    BACK
    Nike's run-up to the Olympics
    A major footwear supplier to the Games, and no. 153 on this year's list, says it's not their job to address concerns over human rights in China. Watch
  • BACK
    Apparel giant's success secret
    VF, no. 335 on this year's list, boosts growth by buying successful cult brands, like shoemaker Vans, and giving them freedom to flourish. Watch
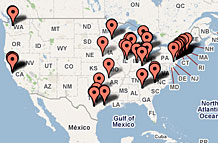
FAQ and methodology
Included in the survey are U.S. incorporated companies filing financial statements with a government agency. This includes private companies... More
Current Issue
  • Give the gift of Fortune
  • Get the Fortune app
  • Subscribe

Our annual ranking of America's largest corporations

  • All
    companies
  • All
    industries
708 of 1000
BACKNEXT
708. Mirant
Financials: Latest Results
Rank: 708 (Previous rank: 474)
Compare tool: Mirant vs. Top 10
CEO: Edward R. Muller
Address: 1155 Perimeter Center W.
Atlanta, GA 30338
Phone: 678-579-5000
Website: www.mirant.com
Revenues 2,815.0 -39.9
Profits 1,995.0 7.0
Assets 9,452.0
Stockholders' equity 5,310.0
Market value (3/28/2008) 7,701.5
Revenues 70.9
Assets 21.1
Stockholders' equity 37.6
2007 $ 7.20
% change from 2006 14.6
1997-2007 annual growth rate % N.A.
2007 23.5
1997-2007 annual rate N.A.
Industry: Energy
1 Constellation Energy 117 21,193.2
2 Oneok 192 13,477.4
3 American Electric Power 196 13,380.0
4 Williams 208 12,994.0
5 Reliant Energy 237 11,208.7
6 Integrys Energy Group 254 10,408.1
7 Energy Future Holdings 317 7,992.0
8 Calpine 318 7,970.0
9 Global Partners 364 6,757.8
10 NRG Energy 403 6,039.0
11 UGI 437 5,476.9
12 Dynegy 612 3,410.0
13 New Jersey Resources 671 3,021.8
14 Mirant 708 2,815.0
15 Questar 723 2,726.6
16 Adams Resources & Energy 744 2,636.2
17 Ferrellgas Partners 900 1,992.4
18 USEC 912 1,928.0
From the May 5, 2008 issue
Revenues: Includes revenues from discontinued operations.
See Mirant in...
...Top 50 Headquarters
MAPS
...What Readers Say
They speak out on Mirant and other 500 companies...


Most stock quote data provided by BATS. Market indices are shown in real time, except for the DJIA, which is delayed by two minutes. All times are ET. Disclaimer. Morningstar: © 2018 Morningstar, Inc. All Rights Reserved. Factset: FactSet Research Systems Inc. 2018. All rights reserved. Chicago Mercantile Association: Certain market data is the property of Chicago Mercantile Exchange Inc. and its licensors. All rights reserved. Dow Jones: The Dow Jones branded indices are proprietary to and are calculated, distributed and marketed by DJI Opco, a subsidiary of S&P Dow Jones Indices LLC and have been licensed for use to S&P Opco, LLC and CNN. Standard & Poor's and S&P are registered trademarks of Standard & Poor's Financial Services LLC and Dow Jones is a registered trademark of Dow Jones Trademark Holdings LLC. All content of the Dow Jones branded indices © S&P Dow Jones Indices LLC 2018 and/or its affiliates.