|
Get Quote: DIS
Financials: Latest Results
Rank: 60 (Previous rank: 67)
Compare tool: Walt Disney vs. Top 10 CEO: Robert A. Iger Address: 500 S. Buena Vista St. Burbank, CA 91521 Phone: 818-560-1000 Website: www.disney.com | ||||||||||||||||||||||||||||||||||||||||||||||||||||||||||||||||||||||||||||||||||||||||||||||||||||||||||
Industry: Entertainment
|
What Readers Say
They speak out on Exxon Mobil and other 500 companies...
| |||||||||||||||||||||||||||||||||||||||||||||||||||||||||||||||||||||||||||||||||||||||||||||||||||||||||
Find your top companies
Video (1 of 6)
-
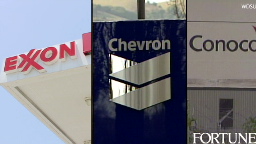
 Exxon Mobil shoved aside Wal-Mart to retake the No. 1 slot. But the Fortune 500 had its worst slump ever. Watch
| Rank # of Fortune 500 Companies | |
|---|---|
| Texas | 64 |
| New York | 56 |
| California | 51 |
| Company | Rank |
|---|---|
| Valero Energy | 10 |
| Microsoft | 35 |
| Goldman Sachs | 40 |
| Company | 2008 $ (millions) |
|---|---|
| Exxon Mobil | $45,220.0 |
| Chevron | $23,931.0 |
| Microsoft | $17,681.0 |
FAQ and methodology
Included in the survey are U.S. incorporated companies filing financial statements with a government agency. This includes private companies... More


