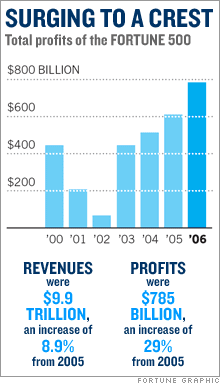
A profit gusher of epic proportionsAmerica's largest corporations generated record earnings in 2006, thanks to a happy confluence of circumstances. How much longer can the outpouring last?(Fortune Magazine) -- The notion of the little guy striking it rich - finding gold at Sutter's Mill, discovering oil at Spindletop, or cashing in on a dot-com IPO in Silicon Valley - runs deep in American lore. But something even more historic transpired in 2006: A massive swath of the established economy - also known as the Fortune 500 - collectively generated unprecedented earnings. The grand total: $785 billion, a 29% increase over 2005. Those returns obliterated the previous cyclical peak, $444 billion, achieved in 2000 at the height of the tech explosion. Put simply, American companies are enjoying the most sumptuously profitable period in the 500's 53-year history. Last year post-tax profit margins hit 7.9%. That's 27% higher than the 6.2% posted in 2000, then lauded as exceptional. 
These happy numbers are largely due to a sort of harmonious convergence, a perfect economic calm. Virtually every conceivable force, from mild labor costs to a falling dollar to soaring productivity, has favored big companies. "For the past few years business couldn't have asked for a better environment for profits," says Mark Zandi of Moody's Economy.com. But companies also deserve credit for their restraint. Instead of squandering their good fortune on poor acquisitions and other bad investments, they used a huge chunk of those booming profits to reduce debt, a practice that slashed interest payments and drove earnings still higher. Instead of hiring recklessly, they found ways to produce with a trim workforce. To explain this golden age, let's start with the definition of profits: revenues minus expenses, a list that includes the cost of components, interest, depreciation of capital equipment, taxes, and, most of all, labor. This boom is so exceptional because from 2000 to 2006, while FORTUNE 500 revenues trotted forward at a stately 38%, earnings galloped ahead at more than twice that rate. The reason: Sales accelerated far faster than expenses, accounting for the glorious expansion in margins. Hence, the profit story is mainly a tribute to an exceptionally favorable period for costs. Love's labor lost The big gorilla - labor - has stayed remarkably tame in the new century. As measured by the Department of Commerce, the total bill for labor has inched up 4.3% a year. It's reasonable to assume that the 500 experienced a similar increase, since its companies provide a large portion of total U.S. output. Typically labor accounts for around two-thirds of corporate spending. So the FORTUNE 500 was able to raise revenues more than one percentage point faster (5.5% vs. 4.3%), year after year, than its biggest charge, wages. That's highly unusual in the heart of an economic expansion, when companies usually hire battalions of employees. But companies, burned by the tech meltdown and 2001 recession, have kept payrolls amazingly lean this time. Of course, it was easier to do so with large pools of skilled workers available and union power at a nadir. By 2006 companies were barely paying any more for a unit of production than they did in 2000. Companies were aided by a surge in productivity, defined as the hours needed to turn out a car, TV, or any other product or service. "Very little of the productivity increases went to labor," says Ken Goldstein, an economist with the Conference Board, an association of top executives. "So most of those cost savings fell straight to the bottom line." The effect of soaring productivity was dramatic: It took a mere 3.6% increase in the Fortune 500 workforce from 2000 to 2006 to generate a profit increase of almost 80%. The productivity improvement was partially due to the capital-expenditure boom of the '90s. During that period companies gorged on everything from PCs to routers to fiber-optic cables. Flush with airline ticket machines and computerized mortgage applications, companies generated productivity growth that almost matched the modest increase in labor costs. Because they stocked up then, companies haven't had to invest heavily of late. That means depreciation expenses declined sharply, and companies used the cash to chop down their debt. What they didn't retire they often refinanced when rates dropped in 2001, cutting interest expenses still further. From 2001 to 2006 the portion of cash flow going to pay interest dropped from 24% to 13% for U.S. corporations, says Economy.com. The 500 mirrored that trend, with Boeing a typical example: Its interest debt dropped from $358 million in 2003 to $240 million last year. For all the benefit from reduced costs, the revenue side has played a role too. Sales for the 500 got a strong boost from the return of pricing power. Since 2003 a weak dollar has forced importers to boost prices, thereby protecting the flanks of U.S. companies and allowing them to lift prices a healthy 3% a year. Stronger prices, backed by solid growth both here and abroad, raised Fortune 500 revenues 5.5% a year since 2000. The dollar's 15% slide vs. a worldwide basket of currencies brought a second bonus: Foreign sales translated into far more dollars. |
Sponsors
|

