Back to feature
5. McAllen, TX
5. McAllen, TX
57% Projected gain in home prices (5-year)*
Median home price Median home price
2006: $70,000
2011: $109,000
Population Population
2006: 695,000
2011: 785,000
Per capita income Per capita income
2006: $17,000
2011: $23,200
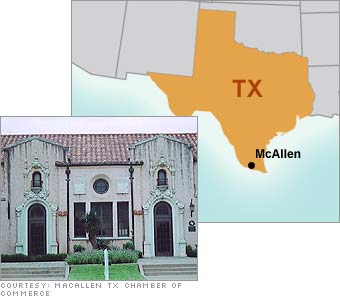
*Metro region statistics


A Hispanic baby boom is working its way through the regional economy, and families will soon be trading up their digs. McAllen is already 85% Latino, and the average age of those households is two decades younger than that of non-Hispanic ones.

Latino families are also larger: 3.8 members, on average, compared with 2.4 for Caucasians. "These border towns have a housing shortage," Cochrane says. "There's pent-up demand. They'll be looking for more space and better space."

He predicts that incomes will catch up to the area's economic growth, currently more than double the state average of 2.9%. So far, cheap labor has driven a development boom. Manufacturers locate on both sides of the border to take advantage of low wages and the common market for goods created by NAFTA.

CAUTION: As the economy matures, higher-paying industries like health care and business services will grow. The area could lose its low-wage "nearshoring" edge, slowing down industrial growth and the demand for new homes.

Most stock quote data provided by BATS. Market indices are shown in real time, except for the DJIA, which is delayed by two minutes. All times are ET. Disclaimer. Morningstar: © 2018 Morningstar, Inc. All Rights Reserved. Factset: FactSet Research Systems Inc. 2018. All rights reserved. Chicago Mercantile Association: Certain market data is the property of Chicago Mercantile Exchange Inc. and its licensors. All rights reserved. Dow Jones: The Dow Jones branded indices are proprietary to and are calculated, distributed and marketed by DJI Opco, a subsidiary of S&P Dow Jones Indices LLC and have been licensed for use to S&P Opco, LLC and CNN. Standard & Poor's and S&P are registered trademarks of Standard & Poor's Financial Services LLC and Dow Jones is a registered trademark of Dow Jones Trademark Holdings LLC. All content of the Dow Jones branded indices © S&P Dow Jones Indices LLC 2018 and/or its affiliates.

Most stock quote data provided by BATS. Market indices are shown in real time, except for the DJIA, which is delayed by two minutes. All times are ET. Disclaimer. Morningstar: © 2018 Morningstar, Inc. All Rights Reserved. Factset: FactSet Research Systems Inc. 2018. All rights reserved. Chicago Mercantile Association: Certain market data is the property of Chicago Mercantile Exchange Inc. and its licensors. All rights reserved. Dow Jones: The Dow Jones branded indices are proprietary to and are calculated, distributed and marketed by DJI Opco, a subsidiary of S&P Dow Jones Indices LLC and have been licensed for use to S&P Opco, LLC and CNN. Standard & Poor's and S&P are registered trademarks of Standard & Poor's Financial Services LLC and Dow Jones is a registered trademark of Dow Jones Trademark Holdings LLC. All content of the Dow Jones branded indices © S&P Dow Jones Indices LLC 2018 and/or its affiliates.