Back to feature
6. San Luis Obispo, CA
40% Projected gain in home prices (5-year)*
Median home price Median home price
2006: $440,000
2011: $615,000
Population Population
2006: 261,000
2011: 287,000
Per capita income Per capita income
2006: $34,400
2011: $42,900
*Metro region statistics


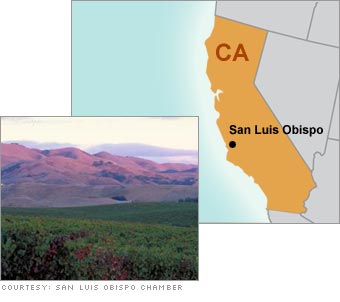
SLO-Town, as the locals call it, is on the development fast track. It's in the middle of the last semi-rural stretch of central California coastline, and it's also home to the state's rising star of wine production, Paso Robles, where even French vintners are buying property.

The Median home price in Paso Robles has shot up by more than 100% since 2000. And according to local developer Peter Laughlin, commercial land has skyrocketed from $3 to $20 a square foot since 2001.

Yet the natural amenities, proximity to Southern California, and relatively low prices support forecasts of a continuing surge. Thousands of retirement-age boomers, it's said, will sell their SoCal homes for cheaper digs in SLO. Anti-development sentiment also helps. "They're not zoning quickly enough for the demand," Laughlin says. "Either they have to allow more homes or prices will go through the roof."

CAUTION: Prices are already getting ahead of job and income growth.

Most stock quote data provided by BATS. Market indices are shown in real time, except for the DJIA, which is delayed by two minutes. All times are ET. Disclaimer. Morningstar: © 2018 Morningstar, Inc. All Rights Reserved. Factset: FactSet Research Systems Inc. 2018. All rights reserved. Chicago Mercantile Association: Certain market data is the property of Chicago Mercantile Exchange Inc. and its licensors. All rights reserved. Dow Jones: The Dow Jones branded indices are proprietary to and are calculated, distributed and marketed by DJI Opco, a subsidiary of S&P Dow Jones Indices LLC and have been licensed for use to S&P Opco, LLC and CNN. Standard & Poor's and S&P are registered trademarks of Standard & Poor's Financial Services LLC and Dow Jones is a registered trademark of Dow Jones Trademark Holdings LLC. All content of the Dow Jones branded indices © S&P Dow Jones Indices LLC 2018 and/or its affiliates.

Most stock quote data provided by BATS. Market indices are shown in real time, except for the DJIA, which is delayed by two minutes. All times are ET. Disclaimer. Morningstar: © 2018 Morningstar, Inc. All Rights Reserved. Factset: FactSet Research Systems Inc. 2018. All rights reserved. Chicago Mercantile Association: Certain market data is the property of Chicago Mercantile Exchange Inc. and its licensors. All rights reserved. Dow Jones: The Dow Jones branded indices are proprietary to and are calculated, distributed and marketed by DJI Opco, a subsidiary of S&P Dow Jones Indices LLC and have been licensed for use to S&P Opco, LLC and CNN. Standard & Poor's and S&P are registered trademarks of Standard & Poor's Financial Services LLC and Dow Jones is a registered trademark of Dow Jones Trademark Holdings LLC. All content of the Dow Jones branded indices © S&P Dow Jones Indices LLC 2018 and/or its affiliates.