NEW YORK (CNN/Money) -
A weakened economy. A looming war with Iraq. Three years of stock market losses.
And now, as if investors don't have enough to worry about, all three of the major indexes ended the month of January with a loss -- a sure sign that the market is heading lower for the year.
Wall Streeters were afraid. Very very afraid. As it became clear Friday that a last-day miracle wasn't going to salvage the month, they were on the phone canceling travel plans, pulling their kids from ritzy Manhattan schools.
As April goes...
OK, so maybe it didn't work quite like that, but traders do keep an eye on January's performance. Look at the S&P 500 since 1950 and you'll see that January has predicted the markets' performance for the year all but 10 times. Stunning, right? Hang on.
"Part of the reason the January barometer works so well is a statistical faux pas," said John Bollinger, head of Bollinger Capital. "It uses January to predict the year, not the following 11 months."
Take 1987, a year that the January indicator "worked." The S&P tacked on 13.2 percent in January, and closed the year up 2 percent. But from the end of January to the end of December, it fell 9.9 percent.
Still, January has a decent record of predicting stocks' direction for the following 11 months of the year, failing just 13 of the last 50 times. But April's not far behind, failing only 16 out of 50 times. How come nobody talks about the April barometer?
Hubba hubba for hemlines
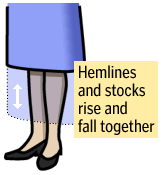
When people talk about traders' love for statistical nonsense, the hemline theory -- when hemlines go up, so do stocks -- invariably comes up. What could be sillier than thinking the length of skirts has anything to do with stocks? Sounds more like an excuse traders in Wall Street's mostly boys club came up with to look at women's legs.

But Bollinger thinks that there may really be something to the hemline indicator -- or at least that there was. "I think hemlines were a good indicator in their day," he said. "It talks to euphoria and depression and how people behave in a mass sense."
Hemlines rising showed that people were loosening up and living high. When they fell, they spoke to a rise in the conservative mores which often translated into investing conservatism as well. In a similar vein, Leonard Lauder, the chairman of Estee Lauder, has said that lipstick sales are a good indicator of consumer behavior.
Sadly, hemlines' height doesn't say the same things that it used to, said Bollinger, and we have to find some other indicator to track mass psychology. Maybe TV shows? A few years ago the big TV networks were falling all over themselves looking to come up with sitcoms with "Sex and the City" sensibilities. Nowadays it's all about family fare.
Super silliness
Say the following in your best football announcer voice:
It was January 15, 1967, when Vince Lombardi's Green Bay Packers stormed the field to determine the course of the American stock market for the remainder of the year.

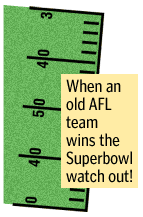
Ah, the Super Bowl indicator. When a team from the old American Football League (AFL) wins the championship (like last year when the New England Patriots won) it's going to be a down year. From 1967 to 1997 this indicator was right 27 of 30 times -- an amazing 90 percent success rate. But then it got the market wrong four times in a row, revealing itself, according to Legg Mason strategist Paul Macrae Montgomery, as the statistical anomaly that it is.
"I usually write up the Super Bowl indicator every year just to say it's nonsense," he said. "It's an example of data mining -- you can always find a series that fits. In the 1920s there used to be a Harvard-Yale indicator."
And in any case, nobody knew what to make of the Super Bowl indicator this year after the Tampa Bay Buccaneers, an expansion team, won the big game. But at least the Oakland Raiders, one of those old AFL teams, didn't win.
Hurray for the Super Bowl indicator!
God bless you, Mrs. Whistleblower
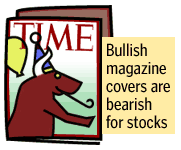
Macrae Montgomery has a quirky indicator of his own -- he likes to look at the covers of the major weekly magazine covers.

When a bull graces the front of, say, Time or Newsweek, he thinks it's shows that virtually all the good news in the market is so widely known that stocks have only one direction to go: down. A bearish cover, conversely, is a fine time to buy.
A recent example was in April of 1998, when Newsweek ran with a bull (in a wedding dress) on its cover trumpeting the story "Why We're Married to the Market." Not too much later, the Russian debt crisis hit and the market went into a sickening decline. Mercifully, in October the editors of Newsweek printed a black cover emblazoned with "The Crash of '99?" And so stocks recovered.
And now. Although there have been no bulls or bears on the major news weeklies' covers, Montgomery thinks that Time's choice of Amazon founder Jeff Bezos as person of the year in December 1999 was a good sign that the end was nigh for the bull market. And he's heartened that Time's editors just heaped praise on the women who helped uncover the messes at Enron and WorldCom when they declared 2002 the "Year of the Whistleblower."

|

