NEW YORK (CNN/Money) - Ask a trader what ails stocks lately and you'll probably hear a litany of worries which can be boiled down to just one word: Iraq. Were it not for investors' geopolitical jitters, the market would be in much better shape.
But what's really worrisome is that the market doesn't appear all that worried -- yet -- which means that stocks may have much further to fall before they touch bottom.
"The market is getting toward the October lows," said Weeden strategist Steve Goldman, "but there's still a sense of complacency. As far as sentiment is concerned, we're in a lukewarm area, not red hot."
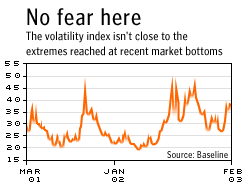
The most closely watched sentiment indicator on Wall Street is the Chicago Board Options Exchange's Volatility Index, better known simply as the Vix. The Vix measures not actual volatility, but what's called implied volatility of the S&P 100 index. Implied volatility measures how volatile investors in the options arena think the market is going to be, and has become a good proxy for how worried investors are.

So, for example, when stocks were plummeting this past summer, the Vix was screaming higher. It went from a level of around 30 in June on up to 50 when stocks hit their summer low point in July. When stocks hit their October lows, again the Vix jumped up to near the 50 level. Following Sept. 11, the Vix also approached 50.
Since the beginning of 2003, it's risen from around 30 to 39.
"It certainly hasn't registered the kinds of extremes it has in past selloffs," said Lowry Reports technical analyst Richard Dickson.
Dickson believes that the fear is coming, however, and that the market is heading toward what traders and technical analysts call capitulative selling, when investors scuttle shares wholesale in a desperate attempt to shift into cash. The plus side to such selling is that it can mark an important bottom in the market, and that buying at such times can be terrific. Of course you need to have cash to buy, and keeping your head when everyone else is losing their's can be hard.
"Right [now] what we're thinking is we'll see that dumping of stock if we take out those October lows," he said.
Dickson's bet right now is that that selling is going to happen. The Dow Jones industrial average had a closing low of 7,286 on Oct. 9, about 500 points from where it is now. The S&P 500 is 6 percent away from its October nadir.
The key, thinks Mizuho Securities futures division vice president Phil Ruffat, will be to see if the Vix pokes its head over 40 for a few days. If that happens, Ruffat sees a spike up to 50, and all the fear and selling that implies, as inevitable.
"The problem with volatility is that it's volatile," he said. "It just tends to feed on itself. There isn't a lot of fear in the market right now, but there could be."
Ruffat does think, however, that the market could still manage to muddle through without courting a heavy selloff.
"We just need two or three days of nothing Iraq," he said.
It's hard to have much confidence that that's something we're going to get.

|

