NEW YORK (CNN/Money) -
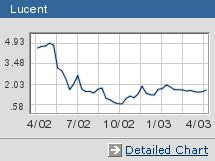
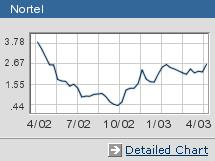
Talk about "Night of the Living Dead." Lucent up 25 percent this year. Nortel up nearly 60 percent.
Of course, for Lucent that meant going from $1.26 to $1.58, and for Nortel from $1.61 to $2.57 -- but a gain is a gain.
What explains the bounce-backs? Well, first and foremost, both companies have boosted their cash positions, fending off bankruptcy, which had been a concern last year.
Lucent had $3.7 billion in cash and short-term securities as of the end of December and $3.2 billion in long-term debt. Nortel had $3.9 billion in cash and $3.8 billion in long-term debt. Not pristine balance sheets, but not bad either.
The possibility of either stock being delisted isn't as great, either. Not only are both stocks above $1, Lucent (LU: Research, Estimates) shareholders approved a proposal for a reverse stock split in February and Nortel (NT: Research, Estimates) is set to vote on one Thursday. (Lucent has yet to decide if it will do a reverse split. It just has approval to do so.)
In addition ... well, actually, that's about it.
Steven Salopek, co-manager of the One Group Technology fund, calls the moves in both stocks "baffling." He owns neither in the fund. The main reason why he's avoided them is that profitability still is a few quarters off at least.
Lucent will report its fiscal second-quarter numbers Wednesday and Nortel will announce its first-quarter results Thursday. In addition to a quarterly loss, both companies are expected to post mammoth year-to-year declines in sales: Analysts forecast a 31 percent drop for Lucent and 20 percent decrease for Nortel.
Carriers still not spending
And it's not as if there's much to get excited about in the immediate future, either. Telecom carriers, the companies that buy equipment from Lucent and Nortel, aren't throwing money around willy-nilly.
Verizon, arguably the best-positioned telecom service provider, reiterated Tuesday that capital expenditures would be between $12.5 billion and $13.5 billion in 2003. Verizon spent $13.1 billion last year.
"At the end of the day the telecom service providers are still under a lot of pressure," Salopek said.
As such, analysts are forecasting losses for Lucent for the next five quarters, a breakeven result in the quarter ending in June 2004, and (FINALLY) a profit of a penny per share in the quarter that ends in September of next year.
So if you're keeping score at home, before it ekes out a profit next year, Lucent is expected to post 14 consecutive quarterly losses, dating back to December 2000.
Nortel has done almost as poorly. Analysts are predicting losses in the second and third quarters of this year, with a slight return to profitability in the fourth quarter. That works out to 11 losses in a row.
Cutting costs ... but at what price?
To be sure, the companies have cut costs aggressively, laying off tens of thousands of workers since the telecom slump began in 2000.
But Jeff Kagan, an independent telecom analyst based in Atlanta, said that as a result, neither company is as innovative as they once were.
Lucent's R&D budget in fiscal 2002 (which ended in September) was 34 percent lower than in 2001, while Nortel's R&D expenses last year dropped 30 percent from 2001.
| Recently in Tech Investor
|

|
|
|
|
"Right now you're looking at two lumbering giants doing everything they can just to survive," Kagan said.
Survival is, of course, an admirable goal. But for Lucent and Nortel to head higher, they have to do more than simply remain on life support.
It looks like the easy money has been made in these stocks.

|