NEW YORK (CNN/Money) - Yes, Wall Street has put on a huge rally since the fall and that is a wonderful thing.
But the big blasts up the Tokyo Nikkei has put on during its trip from the all-time highs hit in December 1989 to its recent lows show that the U.S. market -- to say nothing of the economy -- is hardly in the clear yet.
During its 13-year bear market, the Nikkei has had 15 rallies of more than 15 percent (it's in the midst of its most recent one now). Four of these rallies were in excess of 30 percent, eclipsing the 28.5 percent gain the S&P 500 has seen since it troughed in October.
|
 |  | Start |  | Finish |  | Return |  | August 1992 | September 1992 | 32.1% |  | November 1993 | June 1994 | 34% |  | July 1995 | June 1996 | 56.5% |  | January 1999 | April 2000 | 54.4% |
|  |  |
|
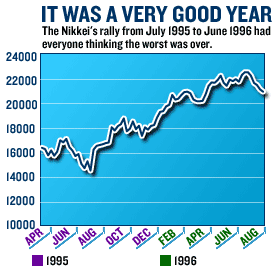
The biggest of the Nikkei's rallies lasted nearly a year. Kicking off in early July of 1995 and coming to a close in late June 1996, it took the index up a whopping 56.5 percent.
It was a heady time, with policy makers, economists and investors all enthusing that the long hangover from the excesses of the late 1980s had finally come to a close. The government had passed two big stimulus packages -- "Emergency Measures for Yen Appreciation and the Economy" in April 1995 and "Economic Measures Toward Steady Economic Recovery" in September 1995.
The first one helped give the economy a kick start, and the second (which doesn't have such a redundant-sounding headline in Japanese) got things really cooking. According to Institute for International Economics senior research fellow Adam Posen, the two packages added 10.7 trillion yen -- a little more than $100 billion at the day's exchange rates -- to the Japanese economy.
Meantime, the Bank of Japan jumped into the fray, taking the country's key overnight lending rate down from 1.75 percent to 1 percent in April, and then dropping it again to a half percent in September 1995. And then there was Ministry of Finance headman Eisuke Sakakibara, who earned the moniker "Mr. Yen" for the way he managed to jawbone the Japanese currency down against the dollar.

Hmmm, massive fiscal stimulus, a central bank cutting rates to the bone and a policy to weaken the yen, which helps Japanese exporters. Why does this all sound so familiar?
Anyway, thanks to all these efforts, Japanese gross domestic product in fiscal 1996 jumped to 3.6 percent growth from the previous year's 0.9 percent -- better than just about any forecasts by private economists. In April 1996, the Nikkei cruised through 21,522 -- a resistance level that had capped rallies three times before. (Again, sounds familiar.) The bear market was over.
But of course it wasn't. On June 26, 1996, the Nikkei closed at a four-year high of 22,666, but then it turned south. Now it's at 8,980.
The rap on the Japanese is that they pulled back too quickly -- they were so worried about running up big deficits that they moved to contractionary economic policies. Hindsight is a wonderful place to criticize from.
"They had very good economic models," said Ron Napier, Salomon Brothers' chief Asian economist in the 1980s, now the head of Napier Investment Advisors. "What the models couldn't cope with is that in post-bubble environments you have a lot of distortions. You can engineer a short-term rebound, but you actually have to take the pain for a while."
U.S. policy makers, of course, are quite aware of how the Japanese economy slipped back into the gloom after its one bright year, and they are determined not to let it happen. They know that pump priming alone is not enough, and that they will need to keep an easy monetary and fiscal policy for some time for the economy to dig itself out.
The problem? Japan's failure may have had nothing to do with the eventual cutting back on economic stimulus, and everything to do with the overcapacity that developed during the bubble years. The United States is dealing with similar excesses, said Dresdner Kleinwort Benson global investment strategist James Montier (who was his firm's Japan economist in 1995), and pouring money on the economy will not make them go away.
"You have overcapacity, and you can keep trying to pump up demand to meet it, but you're going to find it very hard to do," he said. "Eventually, you have to gut the supply."
And unfortunately, there is no painless way to do that.

|

