CNN/Money 
News > Jobs & Economy
graphic
Gas prices set 6th straight mark
Average price for gallon of regular self-serve comes in at $1.753 before OPEC meets to discuss cuts.
March 30, 2004: 10:39 AM EST

NEW YORK (CNN/Money) - Gas prices crept to another record high Tuesday, a day before OPEC meets to discuss its planned oil production cuts in April.

The AAA's survey of gas prices hit a new record of $1.753 a gallon on Tuesday, up 3/10th of a cent from Monday's average. It marks the sixth straight record for the survey, which is updated every weekday.
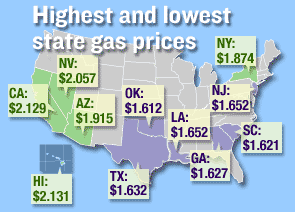
The AAA survey, which breaks down prices by state, found Hawaii with the most expensive gas at $2.131, followed by California at $2.129, while Oklahoma is the cheapest gas at $1.612, followed by South Carolina at $1.621.

Prices could continue to rise as the Organization of Petroleum Exporting Countries seemed ready to go ahead with its production cuts.

Saudi Arabian Oil Minister Ali al-Naimi appeared to make the case Tuesday for OPEC to proceed with planned April output cuts, which he said were already being implemented.

YOUR E-MAIL ALERTS
Oil and Gas
Organization of Petroleum Exporting Countries (OPEC)
Commodities

Naimi said it was too early to say what the likely outcome of a Wednesday OPEC meeting would be, but said producers could not control the speculative investors who have driven oil prices higher this year, adding that OPEC policy should focus on market fundamentals not prices.

In addition, the Lundberg survey, conducted over the past two weeks and released Sunday, showed prices up more than 3-1/3 cents to just over $1.77, said Trilby Lundberg, publisher of the Lundberg Survey, which canvasses about 7,000 U.S. filling stations.  Top of page


  More on NEWS
JPMorgan dramatically slashes Tesla's stock price forecast
Greece is finally done with its epic bailout binge
Europe is preparing another crackdown on Big Tech
  TODAY'S TOP STORIES
7 things to know before the bell
SoftBank and Toyota want driverless cars to change the world
Aston Martin falls 5% in its London IPO


graphic graphic

Most stock quote data provided by BATS. Market indices are shown in real time, except for the DJIA, which is delayed by two minutes. All times are ET. Disclaimer. Morningstar: © 2018 Morningstar, Inc. All Rights Reserved. Factset: FactSet Research Systems Inc. 2018. All rights reserved. Chicago Mercantile Association: Certain market data is the property of Chicago Mercantile Exchange Inc. and its licensors. All rights reserved. Dow Jones: The Dow Jones branded indices are proprietary to and are calculated, distributed and marketed by DJI Opco, a subsidiary of S&P Dow Jones Indices LLC and have been licensed for use to S&P Opco, LLC and CNN. Standard & Poor's and S&P are registered trademarks of Standard & Poor's Financial Services LLC and Dow Jones is a registered trademark of Dow Jones Trademark Holdings LLC. All content of the Dow Jones branded indices © S&P Dow Jones Indices LLC 2018 and/or its affiliates.

Most stock quote data provided by BATS. Market indices are shown in real time, except for the DJIA, which is delayed by two minutes. All times are ET. Disclaimer. Morningstar: © 2018 Morningstar, Inc. All Rights Reserved. Factset: FactSet Research Systems Inc. 2018. All rights reserved. Chicago Mercantile Association: Certain market data is the property of Chicago Mercantile Exchange Inc. and its licensors. All rights reserved. Dow Jones: The Dow Jones branded indices are proprietary to and are calculated, distributed and marketed by DJI Opco, a subsidiary of S&P Dow Jones Indices LLC and have been licensed for use to S&P Opco, LLC and CNN. Standard & Poor's and S&P are registered trademarks of Standard & Poor's Financial Services LLC and Dow Jones is a registered trademark of Dow Jones Trademark Holdings LLC. All content of the Dow Jones branded indices © S&P Dow Jones Indices LLC 2018 and/or its affiliates.