NEW YORK (CNN/Money) -
The major indexes rose Friday, and for the week, at the end of a tough July on Wall Street. Stocks slid in July on worries that higher energy prices and slower corporate profit growth in the second half of the year will hurt stock valuations.
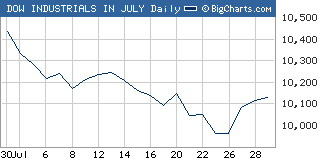
The Nasdaq composite (up 6.30 to 1,887.36, Charts) gained around 0.3 percent. The Dow Jones industrial average (up 10.47 to 10,139.71, Charts) and the Standard & Poor's 500 (up 1.29 to 1,101.72, Charts) index both gained around 1 percent.
For the week, the Nasdaq gained a little more than 2 percent, following a four-week losing streak. The Dow gained 1.8 percent this week, after falling in the previous five. The S&P 500 gained 1.4 percent, rising after six losing weeks.
July certainly lived up to its reputation as one of the worst months of the year for the Nasdaq. The Nasdaq notched a decline of almost 8 percent in July, far worse than the average decline of 0.4 percent over the past 32 years, according to the Stock Trader's Almanac.
The Dow declined 2.8 percent and the S&P 500 slipped around 3.4 percent this month.
"It's been a pretty bad month, but today was a pretty good ending under the circumstances, considering that crude oil closed at a new high and that GDP numbers were so poor," said Paul Mendelsohn, chief investment strategist at Windham Financial Services.
Stocks had been flat to weaker at the start of trade in response to still-high oil prices and some mixed reads on the economy, including weaker-than-expected Gross Domestic Product (GDP) growth.
A midmorning attempt at a broader market rally quickly petered out, leaving only the Nasdaq in the black.
The composite managed to gain due largely to technical, rather than fundamental reasons. The composite dipped below 10-month lows during the session Thursday before managing a bounce. Gains in the beaten-down semiconductor and biotech sectors paced the upturn.
Next week brings an onslaught of July economic numbers, which peaks with the monthly employment report Friday. After a spate of weak June reads on the economy, investors have grown nervous that the pace of economic growth is slowing.
"I think a lot of investors want to see the July numbers and get a handle on whether June was just an aberration or a harbinger of things to come," said Mendelsohn. "The key next week is going to be that employment report."
Monday's most potentially market-moving report is the Institute for Supply Management's manufacturing index, due shortly after the open. The ISM index is expected to rise to 62 from 61.1 in June, according to a consensus of economists surveyed by Briefing.com.
Most of the potentially market-moving earnings have already been released. However, a few are due next week, including Procter & Gamble (PG: Research, Estimates) on Monday before the open. The Dow component is expected to have earned 48 cents per share, up from 44 cents a year ago.
GDP growth disappoints
The pace of economic growth slowed in the second quarter, the government said in a report released early Friday. Gross Domestic Product grew at a 3 percent annual rate in the quarter, from an upwardly revised 4.5 percent rate in the first quarter. Economists were expecting on average that GDP will grow at a 3.7 percent annual rate.
The slowdown was attributed to, among other things, weaker consumer spending and higher energy prices.
Oil prices have been surging this week due to renewed concerns about global supply shortfalls. Light crude oil futures closed at an all-time high Friday of $43.80 a barrel, up $1.05.
But two July reports came in higher than expected, countering some of the negativity.
Released shortly after the open, the University of Michigan's consumer sentiment index was revised up to 96.7 in July from an initial read of 96, surpassing predictions for a rise to 96.2. All in all, the July index was up from the 95.6 read in June.
Also released shortly after the open, the Chicago PMI, a regional read on manufacturing, rose more than expected. The index climbed to 64.7 in July from 56.4 in June, topping forecasts with a rise to 60.
"Oil prices are up, GDP is down and we've got a little month-end cross section here, so we're seeing some volatility," said David Briggs, head of equity trading at Federated Investors.
Tech stocks manage gains
Chip stocks rose, with the Philadelphia Semiconductor index (up 5.24 to 416.43, Charts), or the SOX, rising 1.3 percent, despite Intel (INTC: up $0.14 to $24.38, Research, Estimates), which stalled after saying it won't meet its year-end target for releasing a high-speed chip for desktop computers.
Chip gear maker KLA-Tencor (KLAC: up $2.42 to $41.23, Research, Estimates) rose 6.2 percent after reporting earnings late Thursday that rose from a year earlier and topped expectations.
Multimedia Games (MGAM: down $5.63 to $18.91, Research, Estimates), a maker of electronic gambling machines, plunged nearly 23 percent in active Nasdaq trade. The company reported third-quarter earnings late Thursday that grew from a year earlier but were short of expectations. The company also warned that fiscal fourth-quarter and full-year earnings would miss expectations.
On the upside, shares of Gilead Sciences (GILD: up $5.14 to $64.64, Research, Estimates) rallied 8.6 percent after the biotech reported higher quarterly earnings late Thursday that rose from a year earlier, thanks to strong sales of its HIV medicine.
In the day's biggest deal, Target (TGT: down $0.73 to $43.60, Research, Estimates) said it would sell its Mervyn's department store line for $1.65 billion in cash to an investment group. However, the move was expected, because Target had first put the Mervyn's stores up for sale in March, and Target stock barely moved.
Market breadth was positive, and volume was light. Winners beat losers by more than five to three on the New York Stock Exchange, where 1.29 billion shares changed hands. On the Nasdaq, volume hit 1.49 billion shares, with advancers topping decliners by more than nine to seven.
Although the Democratic National Convention has been going on all week, concluding Thursday with Sen. John Kerry accepting his party's nomination, Wall Street has been more focused on energy prices, as well as earnings and economic data.
"I think the conclusion of the convention brought a big sigh of relief," Briggs added. "Rhetoric wasn't as bad as it could have been, and there was no terrorist attack, when the FBI and others had warned that was a possibility."
Treasury prices rallied, pushing the 10-year note yield down to 4.47 percent. The dollar fell versus the yen and euro. COMEX gold gained $3.90 to $393.70 an ounce.

|