NEW YORK (CNN/Money) -
U.S. stock markets tumbled to new 2004 lows Friday after a surprisingly weak July jobs report intensified fears that the economic recovery is slowing.
 |
|
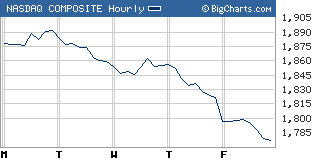
| The Nasdaq this week |
The Nasdaq composite (down 44.74 to 1,776.89, Charts) lost nearly 2.5 percent, closing at its lowest level since August 26 of last year. For the week, it lost 5.8 percent.
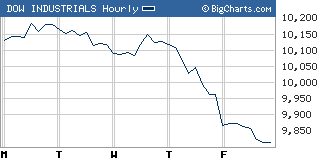
The Dow Jones industrial average (down 147.70 to 9,815.33, Charts) lost 1.5 percent, closing at its lowest point since November 28, 2003. This week, it lost 3.2 percent.
The Standard & Poor's 500 (down 16.73 to 1,063.97, Charts) index also lost around 1.5 percent, closing at its lowest level since December 10 of last year. For the week, it lost 3.4 percent.
Bonds rallied Friday, pushing yields lower on bets that the slower rate of growth means the Federal Reserve won't boost short-term interest rates in September, as was expected previously. However, the Fed is still expected to raise rates by 25 basis points at its policy-setting meeting next Tuesday.
Employers added 32,000 new jobs to their payrolls in July, the government said, after adding a downwardly revised 78,000 in June. Economists surveyed by Briefing.com were expecting 243,000 new jobs for July. Compiled from separate data, the unemployment rate fell to 5.5 percent from 5.6 percent, when economists weren't expecting it to budge.
"It's very disappointing," said Jeff Kleintop, chief investment strategist at PNC Advisors. "It really heightens the uncertainty that has kept the market rangebound all year -- the uncertainty about the economic growth, interest rates, the presidential election, energy costs and the potential for terrorist attacks."
 |
|
| The Dow this week |
After weak reads on the economy in June and some mixed reports in July, investors and analysts alike were looking for a strong July payrolls report to buck the trend. But that was not the case.
"A lot of people were hoping June was a fluke and that employment would bounce back, but two in a row is pretty tough to write off," said Stephen Stanley, chief economist at RBS Greenwich Capital. "I think market investors are now more worried about the corporate and economic outlook."
"Other July data have so far been fairly positive, so there's reason to believe that we'll bounce back," he added. "But If employment growth is really going to slow from here, that will have major implications."
The Fed meeting is the market's main focus next week.
Ahead of that, Monday brings a report on June wholesale inventories, expected to show slower growth, in tune with other June data.
Next week also brings the last of the red hot second-quarter earnings, with reports due from Cisco Systems, Dell, Wal-Mart Stores and Walt Disney. (For a detailed preview of these earnings, click here.)
Investors will also stay focused on oil prices, which have hit new record highs each day this week. NYMEX light crude oil futures hit an all-time high of $44.77 a barrel in electronic trading early Friday, before pulling back. Crude settled at $43.95 a barrel, down 46 cents.
Friday's movers
Stock declines were broad-based, with 29 out of 30 Dow issues tumbling. Intel (INTC: down $0.90 to $22.77, Research, Estimates) was the biggest decliner, down 3.8 percent.
Intel and other chips declined, sending the Philadelphia Semiconductor (down 15.51 to 386.88, Charts) index, or the SOX, down almost 3.9 percent.
Other technology decliners included Cisco Systems (CSCO: down $0.68 to $19.93, Research, Estimates), down 3.3 percent and Oracle (ORCL: down $0.45 to $10.19, Research, Estimates), down 4.2 percent.
Among stocks moving on specific news rather than the general market malaise, nVidia (NVDA: down $5.13 to $9.43, Research, Estimates) plunged over 35 percent in active Nasdaq trade. The graphics chipmaker reported quarterly earnings late Thursday that fell from a year earlier and missed expectations by a substantial margin, due to weak sales.
Video store chain Hollywood Entertainment (HLYW: down $2.98 to $9.81, Research, Estimates) plunged more than 23 percent after saying that its intended purchase by a buyout firm may fall apart due to financing problems.
A rare standout gainer was MCI (MCIP: up $2.15 to $15.99, Research, Estimates), which rallied 15.5 percent after reporting a smaller-than-forecast loss and setting a quarterly dividend of 40 cents per share.
Market breadth was negative. On the New York Stock Exchange, losers beat winners by almost five to three as 1.51 billion shares changed hands. On the Nasdaq, decliners trounced advancers close to four to one on volume of 1.70 billion shares.
Treasury prices soared. The 10-year note yield fell to 4.21 percent from 4.38 percent Thursday. Treasury prices and yields move in opposite directions.
The dollar fell versus the yen and euro. COMEX gold rallied $7.30 to settle at $402.10 an ounce, gaining along with other dollar-traded commodities.

|