NEW YORK (CNN/Money) -
The best case scenario just got worse for Hurricane Ivan, according to a company that projects the dollar punch of the third major hurricane in the last five weeks.
Risk Management Solutions, which does catastrophe modeling estimates for the insurance industry, now projects the storm will cause damages of between $4 billion and $10 billion. That lower estimate would be enough to make the storm among the five most costly in U.S. history. The upper end of the loss estimate would make it the nation's second most costly storm behind only Hurricane Andrew in 1992.
Tuesday RMS's loss estimate range was $2 billion to $10 billion, but Kyle Beatty, meteorologist with RMS, said that for the storm's damages to be limited to between $2 billion to $4 billion, it would have needed to hit a less developed part of the U.S. Gulf Coast and/or weaken. Neither of those mitigating factors now seems likely.
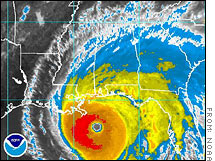
As of 2 p.m. ET Wednesday, Ivan was about 170 miles south of the Alabama coast line. It is still classified as a category 4 hurricane, with sustained winds of 135 mph. A category 5 is the most dangerous hurricane classification. The storm is forecast to be heading towards Mobile, AL, and is expected to come ashore near 7 a.m. Thursday. Millions of Gulf Coast residents from New Orleans to the Florida Panhandle evacuated the costal areas Wednesday. (Click here to check out CNN.com's Hurricane Ivan coverage).
If the storm's insured losses reach to near $7 billion, it would be the second most costly storm in U.S. history. Hurricane Andrew in 1992 caused insured losses of about $20 billion, in inflation-adjusted dollars. Hurricane Charley, which hit the Florida Gulf Coast on Aug. 13, is right now the second most costly storm, with early projected losses of $6.8 billion, according to ISO's Property Claims Services, based on early claims from the storm.
The claims information is not yet available from Hurricane Frances, which hit Florida's Atlantic Coast over the Labor Day weekend. RMS's loss estimate from Frances is $3 billion to $6 billion, while another catastrophe modeling firm, AIR Worldwide, estimates losses of between $5 billion to $10 billion from Frances.
Beatty said one of the risks from Ivan is from flooding. Besides the heavy rains the storm will drop, it is also expected to cause a large increase in the water level, a fact that can be particularly dangerous in a bay such as Mobile Bay.
Flood damage to homes is generally not included in insured loss estimates because private insurers generally don't provide flood coverage to homeowners. A federal program, the National Flood Insurance program, provides that coverage. But Beatty said commercial property owners can buy flood insurance above the limits of the federal program and those privately-insured losses are included in these estimates.
RMS also estimates that Ivan has already caused between $1 billion to $2 billion in insured losses outside the United States as it made its way across the Caribbean, hitting Jamaica, Cuba and the Grand Cayman Islands. Beatty said those losses would have been far worse if there was more extensive insurance coverage and more expensive development in those nations.

|