NEW YORK (CNN/Money) -
Two-year-olds are notoriously disagreeable. That includes two-year-old bull markets -- and the current bull market, if you can still call it that, turns two this month.
And some analysts think the third year of this bull market could seriously try investors' patience.
On Oct. 10, 2002, the Dow Jones industrial average fell to an intraday low of 7,181.47. Between that moment and Feb. 19, 2004, the Dow jumped some 50 percent -- a bull market by just about anybody's definition.
Though the Dow has lost nearly 7 percent since that Feb. 19 peak, most observers still call this a bull market, just one that's suffering through a long, long, long correction.
"As far as we can tell, the bull market is alive and well," Ken Tower, chief market strategist at CyberTrader, a unit of Charles Schwab (SCH: Research, Estimates), wrote in a research note this week.
According to Tower's research, the average bull market since 1949 has lasted, on average, 797 trading days (which don't include weekends and holidays). The latest bull market peaked less than 340 days ago. If that was the end of it -- if the market isn't about to make another run taking it to new highs -- the latest bull market was the shortest in the past 55 years.
"More likely is that we'll get some sort of advance that takes the market to new highs," Tower wrote.

But he also added that the current bull market could be one of the runty ones that come along every so often during rocky economic times and last about 600 days or so.
In other words, if the economy doesn't start showing some long-lasting improvement, and if corporate earnings growth continues to decelerate, then the next bear market will begin right after Inauguration Day next year.
"The stock market will likely continue to soften as long as leading indicators of the economy continue to lose momentum -- a phenomenon which could very well last into 2005," Bear Stearns chief market strategist Francois Trahan wrote Wednesday.
Another reason to worry
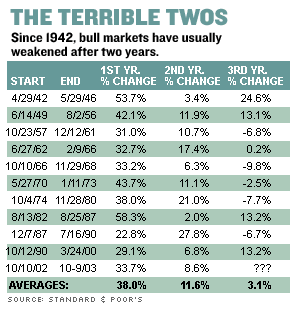
Another set of historical numbers offers yet more reason to worry. Sam Stovall, chief investment strategist at Standard & Poor's, noted recently that bear markets tend to be weakest in their third years.
Since 1942, first-year returns on the S&P 500 have averaged 38 percent, second-year returns have averaged 12 percent, and third-year returns have averaged just 3 percent. The S&P has actually declined in five out of the past 10 third-year bull markets.
| Related stories
|

|
|
|
|
Of course, history can be a lousy guide when it comes to the stock market. In two out of the past three bull markets, according to Stovall's research, the S&P has posted double-digit percentage gains in the third year.
While double-digit gains in 2005 seem unlikely, given the prospect for higher interest rates and slowing earnings growth, stocks don't necessarily have to fall off the table.
"While it will not be a real exciting year, it will at least be an up year," said Chip Dickson, chief equity strategist at Lehman Brothers. "We're talking about real returns of high-single-digits, and that's not so bad."
In such an environment, Dickson and other analysts have suggested that investors get a little defensive, which could mean hunting for "value" stocks -- stocks that the market has overlooked -- and shares that pay growing dividends.
According to Lehman Brothers research, the 59 companies in the S&P 500 that have raised their dividend payout every year for the past 25 years have outperformed the broader S&P by about 4.5 percent per year, on average, since 1989.
"If you can get 4.5-percent incremental performance over the course of 15 years, that really adds up," Dickson said. "That speaks to investing in consistency and quality, as opposed to high valuation."
So the good news is that investors can make money in a world of low market returns. The bad news is they might be forced to do so for many years to come, if one other historical pattern -- the tendency of the market to post sharp gains for 16 years, then to muddle along for 16 years -- holds as some analysts think it will.
If they're correct, then stocks are still in the early stages of a stagnant, up-and-down market that began in about 1998 and could continue until 2014.

|

