CNN/Money One for credit card only hard offer form at $9.95 One for risk-free form at $14.95 w/ $9.95 upsell  
News > Jobs & Economy
graphic
U.S. trade imbalance shrinks
Commerce report shows a $51.6B trade gap in September, smaller than projected.
November 10, 2004: 11:27 AM EST

NEW YORK (CNN/Money) - The U.S. trade gap narrowed in September as the value of oil imports declined, according to a government report Wednesday that put the deficit below Wall Street expectations.
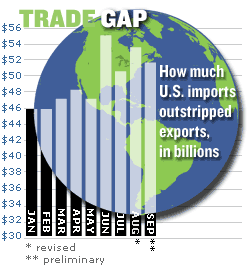
The Commerce Department report showed that the U.S. imported $51.6 billion more in goods and services than it exported. That's down from the revised $53.6 billion trade gap in August. The record gap was $55.0 billion in June.

Economists surveyed by Briefing.com had forecast that the September trade gap would stay at the $54 billion originally reported for August.

While overall imports fell to $149.0 billion from a record 150.2 billion in August, exports rose to a record $97.5 billion from $96.7 billion in August.

The gap with OPEC nations fell to $6.7 billion from $7.0 billion, as crude oil and other oil products saw the value drop 7 percent even in the face of rising oil prices during the month. A nearly 10 percent drop in the volume of oil imports was responsible for the decline.

The trade gap with China, the U.S.'s largest, edged up slightly higher to $15.5 billion from $15.4 billion.

The weak value of the dollar apparently helped exports in September, as it made U.S. goods more price competitive overseas. That could continue going forward as the dollar has remained low.

The dollar hit a new record low versus the euro immediately after the trade report, which is a bit of a surprise since normally a worse than expected trade report would depress the value of the currency, not a narrowing of the trade gap.

YOUR E-MAIL ALERTS
Trade

Concern about what the Federal Reserve might signal about future interest rate hikes when it issues a statement Wednesday afternoon had more impact on the dollar than the trade report, said Ashraf Laidi, chief currency analyst for MG Financial Group.

"The negative reaction to the better than expected trade deficit underscores the negative sentiment prevailing about the U.S. dollar," said Laidi. "The dollar was already under downward pressure. Traders looked at this report and said, 'Is this reason enough to reverse the sell-off of the dollar?' The answer was no. It is the third highest trade gap of all time. It is less than $4 billion from the record high. We're not far from hitting another one."  Top of page


  More on NEWS
JPMorgan dramatically slashes Tesla's stock price forecast
Greece is finally done with its epic bailout binge
Europe is preparing another crackdown on Big Tech
  TODAY'S TOP STORIES
7 things to know before the bell
SoftBank and Toyota want driverless cars to change the world
Aston Martin falls 5% in its London IPO


graphic graphic

Most stock quote data provided by BATS. Market indices are shown in real time, except for the DJIA, which is delayed by two minutes. All times are ET. Disclaimer. Morningstar: © 2018 Morningstar, Inc. All Rights Reserved. Factset: FactSet Research Systems Inc. 2018. All rights reserved. Chicago Mercantile Association: Certain market data is the property of Chicago Mercantile Exchange Inc. and its licensors. All rights reserved. Dow Jones: The Dow Jones branded indices are proprietary to and are calculated, distributed and marketed by DJI Opco, a subsidiary of S&P Dow Jones Indices LLC and have been licensed for use to S&P Opco, LLC and CNN. Standard & Poor's and S&P are registered trademarks of Standard & Poor's Financial Services LLC and Dow Jones is a registered trademark of Dow Jones Trademark Holdings LLC. All content of the Dow Jones branded indices © S&P Dow Jones Indices LLC 2018 and/or its affiliates.

Most stock quote data provided by BATS. Market indices are shown in real time, except for the DJIA, which is delayed by two minutes. All times are ET. Disclaimer. Morningstar: © 2018 Morningstar, Inc. All Rights Reserved. Factset: FactSet Research Systems Inc. 2018. All rights reserved. Chicago Mercantile Association: Certain market data is the property of Chicago Mercantile Exchange Inc. and its licensors. All rights reserved. Dow Jones: The Dow Jones branded indices are proprietary to and are calculated, distributed and marketed by DJI Opco, a subsidiary of S&P Dow Jones Indices LLC and have been licensed for use to S&P Opco, LLC and CNN. Standard & Poor's and S&P are registered trademarks of Standard & Poor's Financial Services LLC and Dow Jones is a registered trademark of Dow Jones Trademark Holdings LLC. All content of the Dow Jones branded indices © S&P Dow Jones Indices LLC 2018 and/or its affiliates.