|
Mind the record trade gap
Appetite for imports, even with strong export growth, may pose long-term risk to economy; heading for a $1 trillion deficit?
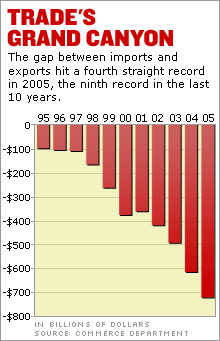
NEW YORK (CNN/Money) - The nation's trade deficit soared 18 percent to nearly three-quarters of a trillion dollars last year -- the ninth record in the last 10 years -- fueling a growing debate over the risks to the U.S. economy, and American workers, posed by imported goods. The December report from the Commerce Department brought the full-year trade gap up to $725.8 billion from the previous record of $617.6 billion set in 2004, as U.S. consumers' appetite for oil, imported cars and cheaper consumer goods produced overseas showed no signs of flagging.
That gap works out to an average of $2,448 per U.S. resident, up from $2,103 per capita in 2004. "It's not just China, it's not just oil," said Jay Bryson, an international economist with Wachovia. "We spend more than we produce, end of story." The report showed U.S. imports outstripped exports by $65.7 billion in December, the third largest monthly gap on record. That was up from the revised $64.7 billion in November and bigger than the forecast of $64.8 billion from economists surveyed by Briefing.com. So far the growing trade gap hasn't caused an economic crisis, partly because foreign investors have continued to buy U.S. assets such as government debt, essentially financing the growing trade gap. "Sooner or later, foreigners will stop financing the deficit. But at this point they show no signs of slowing down," said Bryson. "If there were trade barriers that caused Americans to buy significantly less imports, production here would go up a little, but the thing that would take the brunt of the reduction is that our spending would go down as prices went up. We would have less of everything." But University of Maryland Professor Peter Morici argued in a note Friday that the trade gap is hurting American workers more than they are being helped by lower prices. "Were the trade deficit cut in half, GDP would increase by nearly $300 billion, or about $2,000 for every working American," he said. "Workers' wages would not be lagging inflation, and ordinary working Americans would more easily find jobs paying good wages and offering decent benefits." Morici also argued that the growing trade gap poses a long-term threat to U.S. competitiveness, companies and workers. "By shifting employment away from trade-competing industries, the trade deficit reduces U.S. investments in new methods and products, and skilled labor," he said. Larger trade gaps still lay ahead
If the trade gap grows at the same pace in 2006 and 2007, it will top $1 trillion annually by the end of next year. And an 18 percent growth rate is not out of the realm of possibility; the gap has seen an average 19 percent growth rate since 2002 and nearly 25 percent annual growth rate over the last decade. As recently as 1995 the trade gap was under the $100 billion mark, but it has set new records nine times in the last 10 years. The rise in the gap came even as the nation's exports were strong in December. The report showed both a monthly and annual record. Exports grew by $2.3 billion to $111.5 billion in the month, bringing the value of exports for the year to $1.3 trillion, a 10 percent gain. But imports grew even more, rising $3.3 billion to $177.2 billion for the month. For the year imports grew about 13 percent to just under $2 trillion. And the trade gap is almost certain to grow further. Because imports now outpace exports by such a large amount, exports would have to grow 57 percent faster just to keep the trade gap unchanged. "It's very easy to get the trade gap to narrow, have a recession in the United States to cut spending here," said Bryson. "But I don't think anyone wants that to happen." The trade gap with China was by far the largest with any trading partner, soaring 24 percent to $201.6 billion, or more than a quarter of the overall gap. The U.S.-Japan trade imbalance was the nation's second largest at $75.6 billion, although the European Union would be No. 2 if counted as a single trading partner, with its exports here outstripping its U.S. imports by $109.3 billion. The U.S. gap with Canada was $66.5 billion, just behind Japan. By comparison, the U.S. had a positive trade balance with only six countries identified in the report, with the Netherlands having the largest U.S. trade gap of its own at $11.8 billion for the year. Oil and petroleum products accounted for a $229.2 billion gap during the year, up 40 percent for the year. Much of the increase was caused by the average price of a barrel of imported oil rising about 36 percent during the year to $46.78. Oil accounted for about 31 percent of the overall deficit, up from 26 percent of the smaller 2004 trade deficit. But even without any oil imports, the trade gap would have about a half-trillion dollars in 2005, large enough to have been a record as recently as 2003. And oil was not the only product that produced a trade gap. Imported consumer goods topped the value of those exports by $291.5 billion, even more than the gap caused by oil. But the gap between imports and exports of those goods grew at a far more modest 8 percent. The trade deficit for autos and auto parts edged up 2 percent to $142.2 billion for the full year. There were some areas where the United States is a net exporter. Service sector exports grew 10 percent to $378.6 billion, outstripping services purchased from foreign providers by $56 billion. The exports of civilian aircraft, engines and parts outstripped imports of those goods by $34.6 billion in the year. Both those positive trade gaps grew compared to 2004. ------------------- A first-quarter rebound is coming, but what about the rest of the year? Full story.
Apocalypse ain't nigh. For more, click here. |
| |||||||||||||||||||||||||