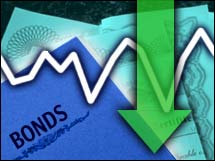
Bond prices give up previous gains
Surprising strength in New York factory sector, worries about capital inflows drag on Treasury market.

NEW YORK (CNNMoney.com) - Treasury prices Wednesday gave up much of their gains from the previous day's big rally on a stronger-than-expected manufacturing report from the New York Fed.

The positive economic number suggested to traders that more interest rate hikes are due from the Federal Reserve in coming months.

The dollar slipped against the euro and yen.

The benchmark 10-year Treasury note declined 7/32 to 98-6/32 to yield 4.73 percent, up from 4.70 late Tuesday.

The 30-year bond fell 23/32 to 95-30/32, yielding 4.76 percent, up from 4.71 percent in the previous session. Bond prices and yields move in opposite directions.

The five-year note fell 1/32, yielding 4.69 percent, and the two-year note was down two ticks, yielding 4.68 percent.

The New York Federal Reserve's "Empire State" factory survey rose to 31.2 in February, the highest in nearly two years, versus forecasts for a drop to 19.

Prices also got a downward push from news that capital inflows into bonds slipped in January.

Purchases of Treasuries fell to $4.4 billion in January from $18.3 billion in December. Treasuries took a hit on the news, suggesting that the market was expecting a larger number.

Bonds were little changed on the afternoon release of the Fed's Beige Book data, which generally confirmed traders' consensus about upcoming interest rate hikes.

In currency trading, the euro bought $1.2069, up from $1.2021 late Tuesday, while the dollar edged lower to ¥117.32 from ¥117.42 in the previous session.

_______________________

New Fed chief Ben Bernanke is 'quite concerned' about the budget deficit. Full story.

Interest rates are the highest in years, helping to make housing markets even more overvalued. See rankings for 299 marketsTop of page

YOUR E-MAIL ALERTS
Follow the news that matters to you. Create your own alert to be notified on topics you're interested in.

Or, visit Popular Alerts for suggestions.
Manage alerts | What is this?

Most stock quote data provided by BATS. Market indices are shown in real time, except for the DJIA, which is delayed by two minutes. All times are ET. Disclaimer. Morningstar: © 2018 Morningstar, Inc. All Rights Reserved. Factset: FactSet Research Systems Inc. 2018. All rights reserved. Chicago Mercantile Association: Certain market data is the property of Chicago Mercantile Exchange Inc. and its licensors. All rights reserved. Dow Jones: The Dow Jones branded indices are proprietary to and are calculated, distributed and marketed by DJI Opco, a subsidiary of S&P Dow Jones Indices LLC and have been licensed for use to S&P Opco, LLC and CNN. Standard & Poor's and S&P are registered trademarks of Standard & Poor's Financial Services LLC and Dow Jones is a registered trademark of Dow Jones Trademark Holdings LLC. All content of the Dow Jones branded indices © S&P Dow Jones Indices LLC 2018 and/or its affiliates.

Most stock quote data provided by BATS. Market indices are shown in real time, except for the DJIA, which is delayed by two minutes. All times are ET. Disclaimer. Morningstar: © 2018 Morningstar, Inc. All Rights Reserved. Factset: FactSet Research Systems Inc. 2018. All rights reserved. Chicago Mercantile Association: Certain market data is the property of Chicago Mercantile Exchange Inc. and its licensors. All rights reserved. Dow Jones: The Dow Jones branded indices are proprietary to and are calculated, distributed and marketed by DJI Opco, a subsidiary of S&P Dow Jones Indices LLC and have been licensed for use to S&P Opco, LLC and CNN. Standard & Poor's and S&P are registered trademarks of Standard & Poor's Financial Services LLC and Dow Jones is a registered trademark of Dow Jones Trademark Holdings LLC. All content of the Dow Jones branded indices © S&P Dow Jones Indices LLC 2018 and/or its affiliates.