|
Tough 6 months on tap for stocks?
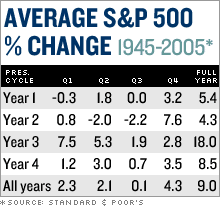
Judging by the history books, and the cycles of the presidency, the market could be in for a rough few months after hitting 5-year highs.
NEW YORK (CNNMoney.com) - Ah, spring time. That glorious time of year when flowers are a-bloomin', birds are a-chirpin' and stocks are a-slippin'. And in the case of stocks, they may be a-slippin' for the next two quarters, according to a Standard & Poor's study released Monday.
As Henny Penny and various other market historians will tell you, 2006 is asking for a fall. Those who argue that the stock market follows the four-year cycle of the presidency note that year two is typically the worst. And 2006 is year two of President Bush's second term. And the worst of the worst? The second and third quarters, according to Standard & Poor's. Over the last 60 years, the second quarter of year two has been good for an average decline of 2 percent on the S&P 500. The third quarter has been good for an average decline of 2.2 percent. Why is that? The third quarter is typically the worst for the market in any year, with many bulls on the golf course or on the beach, and not necessarily interested in making big switches to their portfolios. In addition, patient investors who have been willing to overlook disappointing earnings from a company during the first quarter tend to get fed up should earnings disappoint for a second quarter. These second-quarter earnings are typically released at the start of the third quarter. The second quarter tends to be pretty positive in years other than the second year of a presidency, but also tends to be more choppy in year two, starting or leading into a sell-off. "When you combine the fact that year two of a president's term in office is the weakest of the four, with two seasonally weak quarters, you get a result that's pretty dismal," said Sam Stovall, Standard & Poor's chief investment strategist. 2006 to follow suit?
And this year brings nothing to suggest that stocks will buck the trend. The Dow industrials and the S&P 500 are both near five-year highs. The Nasdaq has lagged, but nonetheless remains near its 4-1/2 year high hit in January. As Stovall points out, from a contrarian perspective, that suggests the market is due for a selloff. Plus, the bull market, at 3-1/2, is getting old. There have only been five older ones in history, according to the Stock Trader's Almanac, most recently the 1990-1998 run. In addition, the market has been doing well on bets that the Federal Reserve will stop raising interest rates. But what if it doesn't? That could lead to more tough sledding for stocks. And what if the Fed does stop? What's next to support stocks? It probably won't be earnings. Stovall said S&P expects second-quarter earnings growth to fall to the single-digit range after 15 quarters of at least 10 percent growth. With that kind of slowdown in earnings growth and absent a new catalyst, stocks could be vulnerable. ----------------------------------
Who will really get hurt by Microsoft's delay of Vista?Click here for the story. |
|


