|
Wholesale prices post biggest drop in 3 years
Sharp drop in energy fuels big decline in producer prices but the so-called 'core' increase is bigger than Wall Street economists had forecast.
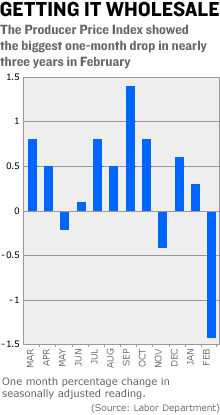
NEW YORK (CNNMoney.com) - Wholesale prices took their biggest tumble in nearly three years in February, led by falling energy prices, the government said Tuesday, but a key measure of inflation excluding energy came in higher than Wall Street forecasts. The Producer Price Index (PPI), which measures prices paid by businesses at the wholesale level, fell 1.4 percent in February due to lower energy and food prices, the Labor Department said. That was the sharpest decline since April 2003, when oil prices fell back from their peak hit just before the start of the war in Iraq.
Economists surveyed by Briefing.com had forecast a 0.2 percent decline following a 0.3 percent rise in January. But the so-called core PPI, which excludes often volatile food and energy prices, rose 0.3 percent last month after rising 0.4 percent in January. Economists had forecast only a 0.1 percent rise in the core, which is more closely watched by economists than the overall PPI reading. A 4.7 percent decline in energy prices was a key to the bigger-than-expected drop in the overall PPI, led by a 24 percent tumble in natural gas prices and a 9.5 percent drop in the price of gasoline. But food prices also fell 2.7 percent. Even with the sharp decline in overall prices, wholesale prices are up 3.7 percent from a year earlier. That's still the lowest 12-month increase since June 2005. Investors have been watching readings on inflation especially closely after the Federal Reserve said recently that economic numbers would determine how long and how far it will keep raising interest rates in a bid to maintain price stability. But investors showed little reaction to Tuesday's PPI report. Last week the Consumer Price Index, a more closely watched reading of inflation at the retail level, showed the core CPI up only 0.1 percent in January, which was less than expected. "It's somewhat anticlimactic because we've already gotten the number the Fed really looks at," said Jason Schenker, economist at Wachovia, referring to last week's CPI reading. He said that while the 0.3 percent rise in the core PPI might seem a bit scary to investors on inflation watch, it was balanced by the big drop in the overall producer price number. Fed Chairman Ben Bernanke, who will preside over his first meeting of the central bank's policy-makers next week, said in a speech Monday night in New York that the Fed would continue to monitor prices and other economic readings as it decides whether to keep raising rates. The Fed has raised its key short-term rate 14 since June 2004, from 1 percent to 4.5 percent. Bernanke said conditions in the bond market, with yields of long-term debt such as the benchmark 10-year Treasury lower than some short-term yields, is not necessarily the signal of economic weakness it has been in the past. Historically, the so-called "inverted yield curve" has been a signal of an economic slowdown or even a recession ahead. In its report, the department said that electronic component prices fell 0.7 percent. But prices for some important items rose, including a 1.4 percent increase in the price of machinery and equipment, a 1.8 percent rise in the price of finished iron and steel products and a 0.9 percent rise in lumber prices. -------------- Lower energy prices ease inflation pressures. Get the full story.
For more on the economy and what it means for investors, click here. |
|


