As summer heats up, gas prices seen cooling
But drop is only expected to be roughly 20 cents a gallon and regular will still cost 34 cents more than last summer.
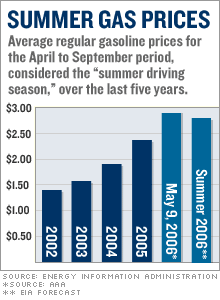
NEW YORK (CNNMoney.com) - Motorists weary from paying near-record gas prices can expect a little relief at the pump, the government said Tuesday. But not much. The Energy Information Administration, in its monthly forecast for fuel prices, said it expects a gallon of regular gasoline to average $2.71 over the summer driving season, from April to September.
That's 34 cents higher than last year's average and a 9-cent increase from EIA's own predictions a month ago. But it's nearly 20 cents cheaper than where gasoline currently stands at $2.901, according to the motorist organization AAA, formerly known as the American Automobile Association. Jonathan Cogan, an EIA spokesman, said prices should drop as U.S. gasoline stocks, hurt by refinery shut-downs and problems switching blends, build. "We think prices will peak earlier in the season," he said. "Perhaps we have seen a turning point." However, Cogan said the EIA's estimates don't factor in the effect of any hurricanes in the Gulf of Mexico, home to one quarter of all U.S. oil production and much of its refining capacity. Gas prices reached their all-time non-inflation-adjusted high of $3.06 a gallon last September after Hurricane Katrina knocked out most production and about half the refineries along the Gulf Coast. Experts are predicting another active season in 2006. EIA also raised its predicted price for crude oil to $68 for 2006 and 2007. Its previous estimate last month was for crude to average $65 a barrel in 2006 and $61 in 2007. It blamed the increase on oil producers' inability to keep up with rising worldwide demand and geopolitics causing supply disruptions. Crude is currently trading around $71 a barrel. Although gasoline prices have surged -- up 33 percent since last year and 9 percent in the last month -- they have started to level off in recent weeks. Over the last two weeks, the average price of gasoline climbed less than 4 cents and actually dropped in 26 cities, according to the Lundberg Survey. That compares to a 25-cent rise reported in the April 21 survey. And in an informal CNNMoney.com poll Monday, the number of readers who said gas prices at their local service stations were falling, rising or staying the same was fairly evenly split. The EIA's previous forecast for summer gas prices, released a month ago, said motorists would be paying $2.62 a gallon on average over the summer, 25 cents higher than the summer of 2005. But analysts at the time said the EIA number was too low, with the average price reported by AAA already a few cents higher than that amount. Rising demand in the U.S., high crude prices and problems at refineries have helped push gasoline prices near their all time highs. _______________ China, Cuba reported in Gulf oil partnership. Click here
How to shop for a fuel-efficient car. Click here |
| ||||||||||||||


