|
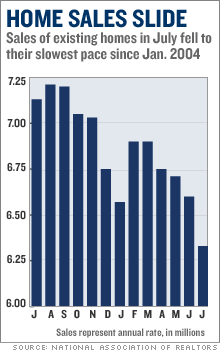
Home sales slump deepens Sales of existing homes slow more than expected in July as supply of homes on the market climbs to 13-year high and prices soften. NEW YORK (CNNMoney.com) -- Home sales slumped more than expected in July, according to a trade group reading that showed the biggest supply of homes for sale in 13 years, coupled with weak prices. The National Association of Realtors reported that existing homes sold at an annual pace of 6.33 million in July, down from the 6.6 million pace in June, which was also revised lower. Economists surveyed by Briefing.com had forecast a 6.55 million pace. The pace of sales was the slowest since January 2004.
The group said that there was a 7.3 month supply of homes on the market, the largest supply of homes for sale by that measure since April 1993. The 3.86 million homes for sale is up nearly 40 percent from a year earlier, and is a record high for the group's report. The increase in supply is due in part to a building boom in 2005, which saw a record number of new homes enter the market. A large percentage of those new homes were intially bought by investors, and home builders have reporting that many of those are now putting those homes up for sale as they attempt to exit the cooling residential real estate market. "Clearly, there is an uncomfortable amount of supply in the existing home market," said Phillip Neuhart, economist with Wachovia. He said that he expected many discouraged home sellers would soon pull their houses off the market, especially if they are not getting the prices they believe their homes to be worth. The glut of homes on the market has cooled off if not killed the white-hot home price gains of a year ago. All regions of the country outside of the South saw a year-over-year decline in median home prices in July, and the South posted only a 3.2 percent year-over-year rise in median home price. Median price is the point at which the same number of homes sell for more and less. While month-to-month declines in home prices in the report are not unusual, a year-over-year decline suggests true weakness in the market. Nationwide median home prices are up just less than 1 percent compared to July 2005. That's a stark contrast to the 12.4 percent gain in prices in 2005 as a whole, or the 9.3 percent gain seen in 2004. The largest year-over-year rise in prices was recorded in October of 2005, when there was a 16.8 percent gain. The much weaker price gains aren't likely to pick up any time soon, according to David Lereah, the Realtors' chief economist. "Now sellers in many areas of the country are pricing to reflect current market realities," he said in a statement included in the report. "As a result, there could be some lift to home sales, but it'll likely take some months for price appreciation to rise." Neuhart said he would expect the median price of homes sold to soon start showing a year-over-year decline, although he said that doesn't mean that overall home values would be declining. "Median home prices do not reflect the price of a given home but the mix of homes sold," he said. "As affordability declines and mortgage rates rise, a greater number of less expensive homes will be bought." Lereah also said the softer pricing outlook was a positive for the real estate market as it brought more buyers into a market that many had found unaffordable. Thomas Stevens, a Virginia Realtor and president of the national group, tried to put the best face on what the softer prices mean for sellers, saying most are not going to lose money on their home sales because they've been in them long enough to benefit from the earlier gains. "Considering that typical sellers have been in their home for six years, the average appreciation during that time is close to 60 percent," he said in the group's statement. More on the real estate market and what it means for you and the economy. |
|


