|
New home price plunge biggest since '70 Prices post nearly a 10% decline from a year earlier and more than 15% from peak; lower prices lift September sales 5.3%. NEW YORK (CNNMoney.com) -- New home prices took their biggest hit in more than 35 years in September, the government said Thursday, the latest sign that builders are struggling to unload a glut of unsold homes as the nation's real estate market cools. The lower prices may have worked, as the annual pace of new home sales climbed 5.3 percent to 1.08 million last month, according to the Census Bureau report. Economists surveyed by Briefing.com had forecast a reading of 1.05 million, which would have been flat with the initial August reading.
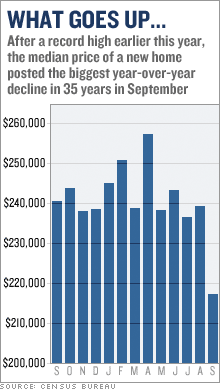
But the median price of a new home tumbled 9.7 percent from a year earlier to $217,100. It was the sharpest drop since December 1970, when prices posted an 11.2 percent decline, and was the fourth largest year-over-year decline on record. The September price slump also marked a 9.3 percent decline from August and a 15.5 percent drop from the record high price of $257,700 posted in April of this year. In addition, the government's measure of prices doesn't capture all the incentives such as free closing costs that many builders have been offering to boost sales. The collapse in pricing is likely due to the oversupply of homes on the market, due greatly to the building boom of last year. The number of completed new homes available for sale at the end of the period rose to a record 157,000. That is up 50,000 homes, or 47 percent, from the supply of completed homes on the market a year earlier. Builders cut back on the supply of homes not yet started that were listed for sale. And homes under construction available for sale also declined from August, although that reading is still up from a year earlier. But even with those signs of the builders trying to put the brakes on supply, the overall inventory of new homes on the market is up about 14 percent from year-ago levels. The median price reflects the point at which half the homes cost more and half cost less. The average price, which typically is higher than the median due to high-priced homes, also fell but only 2.1 percent below year earlier prices to $293,200. But it marked only the third month this year that the average was below the $300,000 benchmark. A report Wednesday from the National Association of Realtors showed the sharpest year-over-year drop on record for the median price of existing homes. New home sales are a much smaller piece of the real estate market than existing homes, but new homes are watched as more of a leading indicator of the market. Existing home sales are booked when a sale closes - typically a few months after a contract is signed - while new home sales are based on contract signings and are considered more forward-looking. New home sales are also seen as important to the supply of homes on the market. Many of the new homes purchased during the boom are believed to have been purchased by investors who are now looking to sell and get out of the softer real estate market. And new home sales also drive construction employment, a key part of the nation's jobs base, as well as sales of appliances, carpeting and other home furnishings. Despite all the recent weakness in housing, there are some signs that the housing slump may be at or near its bottom. Former Federal Reserve Chairman Alan Greenspan said on Thursday that while the housing sector's woes were "not over," he believes the outlook for housing was reasonably good. "Most of the negatives in housing are probably behind us," Greenspan said at a conference sponsored by the Commercial Finance Association. "The fourth quarter should be reasonably good, certainly better than the third quarter." A Census Bureau report earlier this month showed home builders having an unexpected increase in housing starts, and a survey of members by the National Association of Home Builders showed a small improvement in confidence, the first increase in that measure in a year, although those with a negative view of the new home market still outnumbered those with a positive view by a four-to-one margin. The slowdown in new home building has hurt profits and sales for the nation's home builders, including Pulte Homes (up $0.46 to $32.66, Charts), Centex (up $0.66 to $54.27, Charts) D.R. Horton (up $0.34 to $24.31, Charts), Lennar (up $0.80 to $48.27, Charts), K.B. Home (up $0.69 to $46.30, Charts) and Toll Brothers (up $0.06 to $30.50, Charts). Wednesday afternoon Pulte, the nation's No. 1 home builder by market value, became the latest to post a sharp drop in earnings. It also cut its sales forecast for the current period far below forecast. Centex also cut its forecasts earlier in the week. |
|

