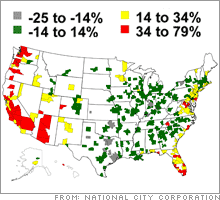
Overheated housing markets cool downA new study says the number of homes in overvalued markets dropped in the first quarter of 2007.NEW YORK (CNNMoney.com) -- Some of the nation's most overheated housing markets may be cooling off to more reasonable levels following their unprecedented run-up in the first half of the decade. According to a report from the financial service companies, National City Corp and Global Insight, the number of single-family homes they judged overvalued in the United States fell from 17 percent in the last quarter of 2006 to 14 percent in the quarter ended March 31.
Of the 317 metro areas covered by the survey, 157 of them, experienced price declines during the quarter. That - combined with wage gains and steady interest rates - reduced widespread overvaluation of homes. The report's authors determined proper home values based on population density, relative income levels, interest rates and historically observed market premiums or discounts. They compared them to actual selling prices to arrive at overvaluations or undervaluations. The figures are important to investors and home buyers because highly overvalued markets are the ones most in danger of future price declines. The latest price declines were mostly clustered in areas that had seen big price run-ups during the boom, with California, Florida, New York and Massachusetts taking hits. James Diffley, managing director of Global Insight's Regional Services Group, said in a statement, "The price declines we are seeing today in California, Florida, and New England were predicted two years ago when we identified them as the most extremely overvalued markets in the nation." Most overvalued areas are on the coasts while the heartland tends to have more fairly valued, even undervalued properties. But economic problems in manufacturing states like Michigan and Ohio caused price drops in those states as well. The report identified Bend, Oregon as the most overvalued metro area in the nation. The median single-family house price there is more than $324,000, almost twice what it sold for four years earlier and 78.7 percent over the survey's valuation price. Bend took over first place from Naples, Florida, which had led the pack for several years. Price declines in Naples enabled it to slip into third place at 63.4 percent overvalued. In second place was Prescott, Arizona, at 64.6 percent. The most undervalued market, according to the survey, is Dallas, where homes sell for 24.9 percent below their proper price. Texas boasts the four most undervalued metro markets in the report. The metro areas facing the greatest threat of future price drops are in California, according to Diffley. He blamed it on a, "huge glut of new and existing homes for sale on the market, and the tightening of credit standards in light of the subprime mortgage troubles [that] will continue to exert downward pressure on prices for some time." |
|

