Bond prices hover higher
Treasury prices are slightly elevated Monday as investors wait for a slew of economic reports.
 |
| Click on the chart to see other government bond prices and yields. |
NEW YORK (CNNMoney.com) -- Government bond prices edged higher Monday as jittery investors continued digesting dour economic data and prepared for more bad news, but also weighed a constant flood of supply headed to market.
Treasury prices have been pulled drastically lower in recent weeks as the market focused on a record amount of supply headed to market. However, the lineup of economic news, combined with something of a slowdown in pace of supply headed to market this week, stopped the sharp drop off in prices.
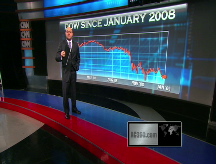
January was the worst month ever for the Dow industrials and S&P 500, as companies continued to struggle in the recession. And job losses continued to mount, with companies slashing more than 100,000 jobs last week. Also adding to investor's negative sentiment was continued debate as to the best way to prop up the banking sector.
Economic reports: A reading on December personal income and spending showed that both decreased in the month, further signs of consumers reigning in their spending.
A key reading on nationwide manufacturing came out at 10 a.m., indicating activity contracted in January for its 12th straight month but the rate of decline slowed.
The government reported Friday that the economy's broadest measure of growth, gross domestic product (GDP), fell at an annual rate of 3.8% in the fourth quarter, the biggest quarterly slowdown in 26 years. The news pushed bond prices higher Friday as investors looked for a safe haven for their assets.
Investors are also bracing for the government unemployment report, due out at the end of this week. It is expected to show that the unemployment rate increased to 7.5% in January, up from 7.2% in the month prior.
Supply waiting on the sidelines: The Treasury has been auctioning off a record amount of government debt in recent weeks, and the flood of supply has been weighing on bond prices.
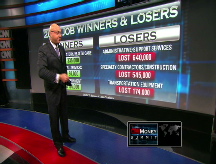
The government was set to auction $58 billion worth of debt this week, including a $29 billion auction of 13-week bills and a $29 billion worth of 26-week bills. Last week, the government sold $135 billion worth of debt, coming on the heels of $120 billion worth of debt brought to market the week before last.
With the government's debt was already expected to pass $1 trillion in fiscal year 2009, and the Senate preparing to vote on the proposed $819 billion stimulus package that the House of Representatives passed last week, the debt market is bracing for a steady volume of bonds headed to market in the future.
Debt prices: The benchmark 10-year Treasury rose 1 6/32 to 108 26/32 and its yield fell to 2.72%. Bond prices and yields move in opposite directions.
The 30-year longbond jumped 2 20/32 to 118 24/32 and its yield fell to 3.48%.
The yield on the 3-month note ticked down to 0.26%. The 3-month bill has been used as a short-term gauge of confidence in the marketplace, because investors tend to shuffle funds in and out of the bill as they assess risk in other places - the lower the yield, the more risk they see.
Lending rates: The 3-month Libor rate increased to 1.22% from 1.18% Friday, according to data available at Bloomberg.com. Meanwhile, the overnight Libor rate dipped to 0.28% from 0.30% Friday.
Libor, the London Interbank Offered Rate, is a daily average of rates that 16 different banks charge each other to lend money in London, and it is used to calculate adjustable-rate mortgages. More than $350 billion in assets are tied to Libor.
Two credit market gauges showed signs that consumers were losing confidence. The so-called "TED" spread widened to 0.96 percentage points Monday from 0.94 percentage points Friday. The bigger the TED spread, the less willing investors are to take risks. The rate surged as the credit crisis gripped the economy, but it has since fallen off as central banks around the world have lowered interest rates and pumped liquidity into the economy.
Another market indicator, the Libor-OIS spread, remained at 0.94 percentage points. The Libor-OIS spread measures how much cash is available for lending between banks and is used for determining lending rates. The bigger the spread, the less cash is available for lending. ![]()


