Search News

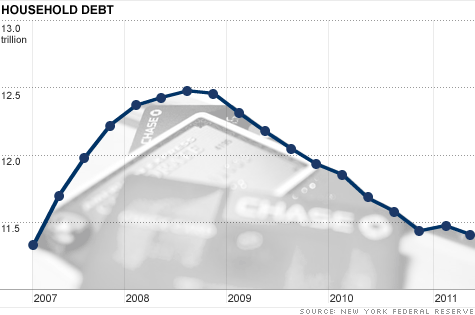
U.S. household debt, which includes mortgages, home equity lines, credit cards, auto loans and student debt fell to $11.4 trillion in the second quarter of 2011.
NEW YORK (CNNMoney) -- Consumer borrowing fell slightly in the second quarter, as Americans shed more of their debt.
A new report released Monday by the New York Federal Reserve -- which looks at mortgages, home equity lines, credit cards, auto loans and student debt held by consumers nationwide -- found that total consumer debt fell to $11.4 trillion in the second quarter of this year.
That marked a $50 billion drop in total consumer debt from the prior quarter, a decrease so slight that the New York Fed called consumer borrowing "essentially flat."
"This is more evidence that the pace of consumer deleveraging that began in late 2008 has slowed," Andrew Haughwout, vice president of the Research and Statistics Group at the New York Fed said in a statement.
Consumer debt remains 8.6% below its $12.5 trillion peak at the end of September 2008, just after the collapse of Lehman Brothers and the seizing of financial markets.
Reeling from the shock of the recession, American households have been paying down their debt slowly for nine of the last 10 quarters. That trend is typically viewed as a healthy rebalancing step for the economy, but at the same time it also limits the recovery.
At some point, consumer borrowing and spending will need to pick up in order for the U.S. recovery to truly take hold. That's why the ability to borrow money more easily is widely seen as an important step for economic growth.
"The economy is certainly not going to recover that much until we see borrowing start to improve again," said Mark Vitner, Wells Fargo senior economist. "On the flip side, we're not going to go back to where we were before, where the recovery was being driven by overspending by consumers."
Total household delinquency rates also continued to improve for the sixth quarter in a row, as overdue balances fell 15% from a year ago.
Housing: Mortgages by far account for the largest portion of consumer debt, totaling $8.5 trillion in the second quarter. Consumers have been cutting back on mortgage debt for nine of the last 10 quarters.
Foreclosure rates have also started to improve. In the last quarter alone, new foreclosures fell about 23% to 284,000. New foreclosures had previously been as high as 566,180 just two years ago.
Meanwhile, mortgage originations recently fell after increasing for three months in a row. New mortgages are now 3% below their year-ago level.
Bankruptcies: About 284,000 Americans filed for bankruptcy in the second quarter, marking a 9.2% increase over the previous quarter.
That said, bankruptcies still remain far below their post-recession peak of about 621,000 in the second quarter of 2010.
Credit cards: Consumers have been consistently cutting back on credit card debt since the end of 2008. Credit card balances recently totaled $690 billion, or roughly 6% of all consumer debt.
Credit card limits have now increased for two quarters in a row, including $60 billion or 2% in the latest quarter. This trend is considered a good sign that consumer credit markets are healing, the New York Fed said.
Student loans: Student debt remains the one type of debt that continues to grow, despite the recession. In fact, it has either increased or remained flat every quarter since mid-2002.
Student debt now totals $550 billion, or 4.8% of total consumer debt, according to the New York Fed.
Auto loans: Auto loans were flat for the fourth quarter in a row, totaling $710 billion.
The New York Fed compiles the household debt report by surveying an anonymous panel of homes across the country about their borrowing decisions. ![]()
| Overnight Avg Rate | Latest | Change | Last Week |
|---|---|---|---|
| 30 yr fixed | 3.80% | 3.88% | |
| 15 yr fixed | 3.20% | 3.23% | |
| 5/1 ARM | 3.84% | 3.88% | |
| 30 yr refi | 3.82% | 3.93% | |
| 15 yr refi | 3.20% | 3.23% |
Today's featured rates:
| Latest Report | Next Update |
|---|---|
| Home prices | Aug 28 |
| Consumer confidence | Aug 28 |
| GDP | Aug 29 |
| Manufacturing (ISM) | Sept 4 |
| Jobs | Sept 7 |
| Inflation (CPI) | Sept 14 |
| Retail sales | Sept 14 |