Search News

NEW YORK (CNNMoney) -- One of the most basic tenets of the American Dream is being called into question by recent economic data. Can each new generation do better than the one before it?
So far, today's young people aren't off to an encouraging start.
According to analysis by the Pew Research Center released Monday, younger Americans have been left behind as the oldest generation has seen wealth surge since the mid-1980s.
While it's typical for older generations to hold more wealth than younger ones who've had less time to save, the gap between the two age groups has widened rapidly.
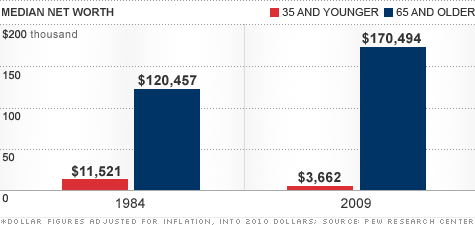
In 1984, households headed by people age 65 and older were worth just 10 times the median net worth of households headed by people 35 and younger.
But now that gap has widened to 47-to-one, marking the largest wealth gap ever recorded between the two age groups.
"We don't know how the story ends, but we know how the story is beginning," said Paul Taylor, executive vice president of the Pew Research Center. "At the beginning, today's young people are not doing better than yesterday's young adults."
Households headed by adults ages 35 and younger had a median net worth of $3,662 in 2009. That marks a 68% decline in wealth, compared to that same age group 25 years earlier.
Over the same time frame, households headed by adults ages 65 years and older, have seen just the opposite. Their wealth rose 42%, to a median of $170,494.
So why the growing chasm?
Whether by choice or due to the weak economy, today's young people are getting their independent lives started later in nearly all respects, taking out more debt, living with parents longer and putting off key milestones like employment, marriage and home ownership longer.
Some of those trends come hand in hand with more young people attending college, which can be a double-edged sword.
While those college credentials could lead to income gains for many young people down the road, surging tuition costs are also leaving them burdened by more student loans than prior generations.
Overall, 37% of the young households held zero or negative net worth in 2009, up from 19% in 1984.
Perhaps the biggest factor leading to the wealth gap between the ages though, is the housing market, the Pew Center said.
While rising home equity helped drive wealth gains for the older generation over the long-term, younger people had less time to ride out the housing market's volatility -- especially its most recent boom and bust.
"Most of today's older homeowners got into the housing market long ago, at 'pre-bubble' prices," the report said. "Along with everyone else, they've been hurt by the housing market collapse of recent years, but over the long haul, most have seen their home equities rise."
"For young adults who are in the beginning stages of wealth accumulation, there has been no such luck, at least so far."
Net worth includes the sum of a household's assets (like equity in a home, car and savings and retirement accounts) minus its debts (like mortgage, car and student loans and credit card debt). ![]()
| Overnight Avg Rate | Latest | Change | Last Week |
|---|---|---|---|
| 30 yr fixed | 3.80% | 3.88% | |
| 15 yr fixed | 3.20% | 3.23% | |
| 5/1 ARM | 3.84% | 3.88% | |
| 30 yr refi | 3.82% | 3.93% | |
| 15 yr refi | 3.20% | 3.23% |
Today's featured rates:
| Latest Report | Next Update |
|---|---|
| Home prices | Aug 28 |
| Consumer confidence | Aug 28 |
| GDP | Aug 29 |
| Manufacturing (ISM) | Sept 4 |
| Jobs | Sept 7 |
| Inflation (CPI) | Sept 14 |
| Retail sales | Sept 14 |