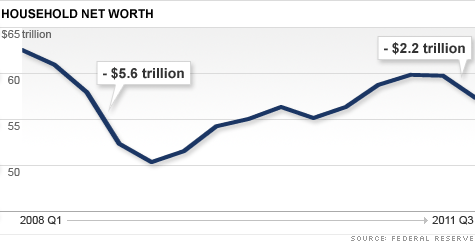
NEW YORK (CNNMoney) -- Household wealth took its biggest hit since the height of the 2008 financial meltdown during the third quarter, weakened by a downturn in stocks, according to a report issued Thursday.
The Federal Reserve said the net worth of households fell by $2.2 trillion, or 4.1%, to end at $57.4 trillion. The decline comes to about $7,800 for every U.S. resident.
It's the biggest decline since the $5.6 trillion loss suffered in the fourth quarter of 2008.
The drop in stocks in the quarter more than explained the overall decline in net worth, as the value of stocks held directly or indirectly fell by $3.2 trillion, or 17%.
That's a bit worse than the 14% decline in the blue-chip Standard & Poor's 500 index during the quarter. The period included the downgrade of the U.S. credit rating by S&P, along with rising worries about the risk of a new U.S. recession and a new meltdown in the financial sector due to the European debt crisis.
But U.S. stocks have performed well since the end of the third quarter, with the S&P 500 rebounding by 10.1% so far. So household net worth might be poised for a nice rebound.
The report also showed that the value of real estate held by households fell by $98 billion, but that was a drop of only 0.6%. Homeowner equity in homes fell by an even smaller amount, only $44.6 billion, as homeowners cut the amount of mortgage debt they owed.
Gregory Daco, principal U.S. economist for IHS Global Insight, said the report shows that a solid 2% gain in consumer spending in the quarter was being done by Americans dipping into their savings, not by any growth in income or net worth.
"IHS expects a strong fourth quarter rebound in household net worth resulting mostly from a rally in stock prices," he wrote in a note Thursday. "This should provide some support to consumer spending as employment growth continues to make progress and consumers cheer up ahead of the holidays."
Household wealth plunged $16.3 trillion in the two years from early 2007 to the first quarter of 2009, and has slowly been climbing since then. But with the drop in the third quarter of this year, households find their net worth still $9.4 trillion, or 14%, below the high they hit in early 2007, before the bursting of the housing bubble. ![]()
| Overnight Avg Rate | Latest | Change | Last Week |
|---|---|---|---|
| 30 yr fixed | 3.80% | 3.88% | |
| 15 yr fixed | 3.20% | 3.23% | |
| 5/1 ARM | 3.84% | 3.88% | |
| 30 yr refi | 3.82% | 3.93% | |
| 15 yr refi | 3.20% | 3.23% |
Today's featured rates:
| Latest Report | Next Update |
|---|---|
| Home prices | Aug 28 |
| Consumer confidence | Aug 28 |
| GDP | Aug 29 |
| Manufacturing (ISM) | Sept 4 |
| Jobs | Sept 7 |
| Inflation (CPI) | Sept 14 |
| Retail sales | Sept 14 |