Growing income inequality has led to ballooning debt loads for the bottom 95% of Americans.
NEW YORK (CNNMoney) -- The rich are getting richer, and everyone else is going deeper into debt trying to keep up.
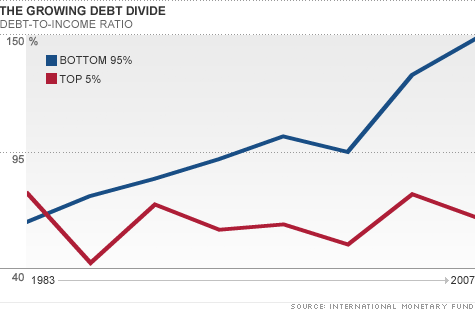
The bottom 95% of Americans have seen debt levels balloon compared to their earnings over the past 20 years or so, as falling incomes made them more dependent on credit to maintain their lifestyles.
In 1983, the bottom 95% had 62 cents of debt for every dollar they earned, according to research by two International Monetary Fund economists. But by 2007, the ratio had soared to $1.48 of debt for every $1 in earnings.
The bottom 95% had incomes of roughly $160,000 or less in 2007, including capital gains.
And then there's the top 5%. Their debt-to-income level actually fell during the same period, from 76 cents of debt for every dollar earned in 1983, to just 64 cents in 2007.
And experts say the picture hasn't changed much since then.
The debt divide is a result of the growing income gap between the wealthiest Americans and everyone else. The top 5% saw their share of total income rise to 34% in 2007, up from 22% in 1983. This excludes capital gains, which pump up the income of the rich even more since they are more likely to invest.
The wealthy had so much extra money lying around that they channeled it back into the financial system, making more credit available to the rest of the nation.
"Rich people have more money to play with and there are only so many Armani suits they can buy. So they can lend money back to the majority," said Michael Kumhof, deputy division chief at the IMF who co-authored the report. Other Americans "are trying to maintain standards of living."
As their wages dropped, some Americans were forced to take on more debt just to stay in place, according to Robert Reich, former Labor Secretary under President Clinton who has written about income inequality.
With credit easier to come by, they financed their spending by taking out home equity loans or refinancing their houses. They also took out more auto and student loans and ran up their credit card balances.
"The only way they could continue to purchase what they need was to go deeper into debt," said Reich, now a public policy professor at the University of California, Berkeley.
Other Americans, of course, used debt to climb up the societal ladder, the so-called "Keeping up with the Joneses" phenomena.
As the wealthy ramped up their spending on luxury goods, the conspicuous consumption tricked down the income brackets, said Russ Morgan, an associate dean at Duke's Fuqua School of Business. For example, a regular stove was no longer good enough, it had to be a pricey Viking stove, he said.
Meanwhile, the wealthier slice of society has done very well in the stock market and in earnings in recent decades.
"They are in quite good shape," Reich said. "They don't need to borrow."
This pattern of sharp increases in income and debt inequality and also has consequences for the larger economy. The two times this happened in history -- the 1920s and the 2000s -- ended with major financial crises, Kumhof said.
While Americans have been shedding their debt since the Great Recession, it's come largely through foreclosure or bankruptcy.
Kumhof doesn't think that's led to much improvement.
"We're still in similar levels of vulnerability as we were in 2008," he said. ![]()
| Overnight Avg Rate | Latest | Change | Last Week |
|---|---|---|---|
| 30 yr fixed | 3.80% | 3.88% | |
| 15 yr fixed | 3.20% | 3.23% | |
| 5/1 ARM | 3.84% | 3.88% | |
| 30 yr refi | 3.82% | 3.93% | |
| 15 yr refi | 3.20% | 3.23% |
Today's featured rates:
| Latest Report | Next Update |
|---|---|
| Home prices | Aug 28 |
| Consumer confidence | Aug 28 |
| GDP | Aug 29 |
| Manufacturing (ISM) | Sept 4 |
| Jobs | Sept 7 |
| Inflation (CPI) | Sept 14 |
| Retail sales | Sept 14 |


