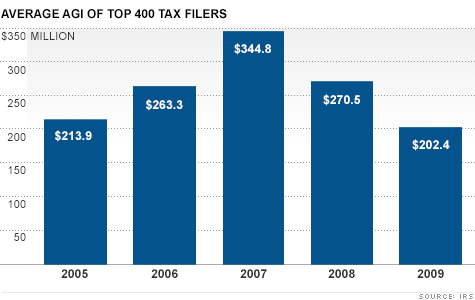
NEW YORK (CNNMoney) -- The 400 tax filers at the top of the income scale hauled in an average of $202.4 million in 2009 -- a 25% haircut from the prior year, according to the latest tax data from the IRS.
The agency recently released its latest annual analysis of the tax returns from the 400 filers with the highest adjusted gross incomes.
Their average AGI was down from $270.5 million in 2008. But their actual incomes may have been higher, since AGI doesn't include tax-exempt income, such as interest from municipal bonds.
The average federal income tax bill among the top 400 in 2009 came to roughly $41 million, down from nearly $49 million the year before.
Overall, the top 400 as a group paid an average effective tax rate of 19.9%, up from 18.1% a year earlier. The average effective tax rate is a measure of one's total income tax bill divided by AGI.
Individually, however, about 40% of them paid an effective rate higher than 25%. But close to a third paid an effective rate below 15%, which is also the case for the majority of Americans.
Lower-income households have very low effective tax rates thanks to a host of credits, deductions and exemptions that cancel out much if not all of their tax bill.
Many of the highest income households enjoy low effective tax rates because they often make a lot of their money from investments, such as capital gains, which typically are taxed at a much lower rate than the 35% top tax rate on ordinary income.
Plus they tend to take far more itemized deductions, such as those for charitable contributions, than everyone else.
The composition of income for the top 400 in 2009 -- the biggest portion of which came from capital gains -- offers a mixed picture.
Their salary and wage income averaged $22.3 million, down from $28.4 million the year before.
Their dividend income rose, but their income from taxable interest, capital gains and partnerships and S corporations fell.
At the same time, their net business income rose a bit and their business losses dropped.
The very wealthy claimed less in itemized deductions than they did the year before.
And their average charitable contributions, which made up nearly half of all deductions claimed, dropped by 28% relative what they'd been the year before. ![]()

Carlos Rodriguez is trying to rid himself of $15,000 in credit card debt, while paying his mortgage and saving for his son's college education.
| Overnight Avg Rate | Latest | Change | Last Week |
|---|---|---|---|
| 30 yr fixed | 3.80% | 3.88% | |
| 15 yr fixed | 3.20% | 3.23% | |
| 5/1 ARM | 3.84% | 3.88% | |
| 30 yr refi | 3.82% | 3.93% | |
| 15 yr refi | 3.20% | 3.23% |
Today's featured rates: