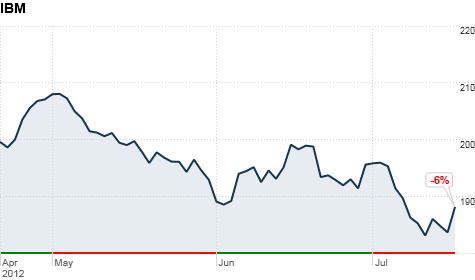
Click chart to view IBM's stock information.
NEW YORK (CNNMoney) -- IBM reported quarterly sales on Wednesday that fell from its year-ago results and missed Wall Street's forecasts, but the company gave a more positive outlook for its future profits.
Sales for the Armonk, N.Y., company fell 3% to $25.8 billion, missing analysts' forecasts of $26.3 billion.
But profits were a strong point. The technology giant said its second-quarter net income grew to $3.9 billion, up 6% from a year earlier.
IBM's results included one-time charges totaling 17 cents per share. Without the charges, IBM said it earned $3.51 per share. Analysts polled by Thomson Reuters, who typically exclude one-time items from their estimates, had forecast earnings of $3.42 per share.
IBM is bullish about earnings and raised its 2012 profit outlook by 10 cents, to $15.10. That topped Wall Street's median forecast of $15.06.
Shares of IBM (IBM, Fortune 500) rose 2% after hours on the news.
IBM's earnings are healthy, but the company has struggled to grow its revenue. The debt crisis in Europe weighed on IBM's sales in that region, which fell 9% compared to last year. That's a worrisome sign: As one of the biggest tech companies in the world, IBM typically serves as a bellwether for the technology sector and the global economy. ![]()


