Search News

Foreclosure fillings fell for the 22nd straight month.
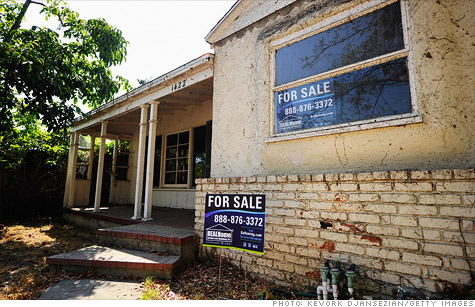
NEW YORK (CNNMoney) -- Foreclosure filings nationwide fell for the 22nd straight month in July, but a spike in new foreclosures indicates that the housing market still has a long way to go before it works through its backlog of problem loans.
In July, foreclosure filings -- including notices of default, scheduled auctions or actual bank repossessions -- were reported on just under 192,000 properties, down 3% from the previous month and 10% lower than last year, according to RealtyTrac, an online marketer of foreclosed properties.
However, foreclosure starts -- the earliest stage of the foreclosure process when delinquent borrowers first receive notices that they are in default -- rose 6% on a year-over-year basis. July marked the third straight month that foreclosure starts have increased on an annual basis.
The new wave of foreclosure filings come in the aftermath of the $25 billion foreclosure settlement, which laid out how the banks could atone for years of abusing the foreclosure process -- including robo-signing. It set firm guidelines for how banks should handle foreclosures and gave them more confidence to start processing foreclosure filings they had previously delayed, said Daren Blomquist, a RealtyTrac spokesman.
That has opened the floodgates in some states, especially in so-called "judicial" states where foreclosures are processed through the courts. Connecticut saw a 201% increase in foreclosure starts in July, while New Jersey and Pennsylvania recorded increases of 164% and 139%, respectively, according to RealtyTrac.
While the spike in new foreclosure filings isn't great news for the housing market, Blomquist predicts that fewer of these homes will actually make it all the way through the foreclosure process to the point of repossession.
In fact, fewer homes are ending up at that point already. Bank repossessions fell 21% year-over-year in July to 53,654, according to RealtyTrac.
Part of that is due to foreclosure prevention programs like the government's Home Affordable Modification Program, said Blomquist.
In addition, banks are processing short sales much more quickly -- and even encouraging borrowers to pursue these transactions before falling into foreclosure. Under these transactions, the home is sold for less than what is owed on the mortgage and the lender agrees to forgive the difference. While the bank still takes a hit on the loan it's a much more favorable option than a foreclosure.
Where the foreclosures are: Like nearly everything in real estate, it's all about location. In some states, like California, foreclosure rates are twice as high as the national average, while in places like North Dakota they're barely a blip on RealtyTrac's radar. (The state had just three last month.)
"[Recent] patterns vary significantly from state to state, often hinging on the level of dysfunction that exists in each state's foreclosure process," said Blomquist.
In states like Florida, Illinois and New Jersey, where the processing of foreclosures slowed significantly last year in the wake of the robo-signing scandal, foreclosure activity is picking up. Meanwhile, in other states, like Texas, Arizona and Virginia, where foreclosures were more quickly processed, foreclosure activity has slowed significantly, he said.
California claimed many of the worst hit markets, including Stockton, Vallejo, Riverside and Modesto. Palm Bay, Fla. was the fifth worst. Las Vegas, once ground zero for foreclosures for years, has dropped out of the top 20. ![]()
| Overnight Avg Rate | Latest | Change | Last Week |
|---|---|---|---|
| 30 yr fixed | 3.80% | 3.88% | |
| 15 yr fixed | 3.20% | 3.23% | |
| 5/1 ARM | 3.84% | 3.88% | |
| 30 yr refi | 3.82% | 3.93% | |
| 15 yr refi | 3.20% | 3.23% |
Today's featured rates: