2013
2012
2011
2010
2009
2008
2007
2006
1955-2005
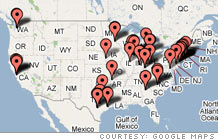
Our annual ranking of America's largest corporations
FORTUNE 500 Headquarters
Click to enlarge
Show FORTUNE 500 Companies:
201
Kinder Morgan
12,208.0
71.9
202
Toys "R" Us
12,206.0
28.0
203
Marriott International
12,160.0
608.0
204
Consolidated Edison
12,137.0
737.0
205
United Auto Group
12,109.9
124.7
206
Phelps Dodge
12,090.2
3,017.8
207
Marsh & McLennan
12,069.0
990.0
208
ONEOK
11,906.8
306.3
209
Bank of New York Co.
11,891.0
3,011.0
210
Sempra Energy
11,850.0
1,406.0
211
Williams
11,812.9
308.5
212
FirstEnergy
11,726.0
1,254.0
213
General Mills
11,640.0
1,090.0
214
Aramark
11,621.2
261.1
215
Circuit City Stores
11,597.7
139.7
216
US Airways Group
11,557.0
304.0
217
Smithfield Foods
11,506.8
172.7
218
Viacom
11,466.5
1,592.1
219
Visteon
11,418.0
-163.0
220
Omnicom Group
11,376.9
864.0
221
Cummins
11,362.0
715.0
222
Medtronic
11,292.0
2,546.7
223
American Standard
11,208.2
541.0
224
EMC
11,155.1
1,224.0
225
Entergy
11,066.6
1,132.6
226
PPG Industries
11,037.0
711.0
227
Genworth Financial
11,029.0
1,328.0
228
KB Home
11,003.8
482.4
229
Reliant Energy
10,985.4
-327.8
230
Sanmina-SCI
10,955.4
-141.6
231
PNC Financial Services Group
10,939.0
2,595.0
232
Kellogg
10,906.7
1,004.1
233
Anadarko Petroleum
10,904.0
4,854.0
234
TXU
10,856.0
2,552.0
235
World Fuel Services
10,785.1
63.9
236
Unum Group
10,718.8
411.0
237
Amazon.com
10,711.0
190.0
238
Progress Energy
10,702.0
571.0
239
Devon Energy
10,696.0
2,846.0
240
Limited Brands
10,670.6
675.7
241
Google
10,604.9
3,077.4
242
Schering-Plough
10,594.0
1,143.0
243
Solectron
10,560.7
133.2
244
Genuine Parts
10,457.9
475.4
245
Baxter International
10,378.0
1,397.0
246
Dean Foods
10,339.0
225.4
247
Aon
10,311.0
720.0
248
Ashland
10,007.0
407.0
249
YRC Worldwide
9,918.7
276.6
250
Principal Financial
9,870.0
1,064.3
251
Xcel Energy
9,847.8
571.8
252
Echostar Communications
9,818.5
608.3
253
ArvinMeritor
9,810.0
-175.0
254
Harrah's Entertainment
9,780.7
535.8
255
Dana
9,724.0
-739.0
256
Alltel
9,723.3
1,129.4
257
Guardian Life of America
9,693.7
431.0
258
Tenet Healthcare
9,622.0
-803.0
259
TEPPCO Partners
9,612.2
202.1
260
Danaher
9,596.4
1,122.0
261
CSX
9,566.0
1,310.0
262
Yum Brands
9,561.0
824.0
263
State St. Corp.
9,525.0
1,106.0
264
Fidelity National Financial
9,436.1
437.8
265
BB&T Corp.
9,414.8
1,528.5
266
Parker Hannifin
9,407.6
673.2
267
Norfolk Southern
9,407.0
1,481.0
268
S&C Holdco 3
9,350.0
-129.5
269
H.J. Heinz
9,331.4
645.6
270
CenterPoint Energy
9,319.0
432.0
271
R.R. Donnelley & Sons
9,316.6
400.6
272
Automatic Data Proc.
9,263.2
1,554.0
273
Dollar General
9,169.8
137.9
274
Applied Materials
9,167.0
1,516.7
275
Air Products & Chem.
9,158.8
723.4
276
Southwest Airlines
9,086.0
499.0
277
Lincoln National
9,062.9
1,315.6
278
Baker Hughes
9,034.1
2,419.0
279
DTE Energy
9,024.0
433.0
280
OfficeMax
8,965.7
91.7
281
Liberty Media
8,948.0
840.0
282
Lucent Technologies
8,796.0
527.0
283
Avon Products
8,763.9
477.6
284
SLM
8,751.2
1,157.0
285
Sonic Automotive
8,706.4
81.1
286
Nordstrom
8,560.7
678.0
287
BJ's Wholesale Club
8,524.2
72.0
288
Reynolds American
8,510.0
1,210.0
289
First American Corp.
8,499.1
287.7
290
Pepco Holdings
8,362.9
248.3
291
Praxair
8,324.0
988.0
292
Rohm & Haas
8,308.0
735.0
293
Apache
8,288.8
2,552.5
294
Fortune Brands
8,255.0
830.1
295
ITT
8,185.9
581.1
296
Hilton Hotels
8,162.0
572.0
297
Ameriprise Financial
8,140.0
631.0
298
SAIC
8,127.0
461.0
299
Fifth Third Bancorp
8,108.0
1,188.0
300
Assurant
8,070.6
717.4
From the April 30th, 2007 issue
Most profitable companies
Fortune 500 methodology Included in the survey are U.S. incorporated companies filing financial statements with a government agency. This includes private companies... (more )