FORTUNE 500 Headquarters
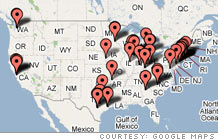
Click to enlarge
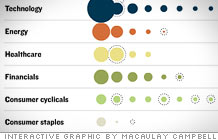
Show FORTUNE 500 Companies:
| 301 |
Hertz Global Holdings
|
8,058.4 |
115.9 |
| 302 |
Gannett
|
8,033.4 |
1,160.8 |
| 303 |
Smurfit-Stone Container
|
7,944.0 |
-59.0 |
| 304 |
Mohawk Industries
|
7,905.8 |
455.8 |
| 305 |
Winn-Dixie Stores
|
7,878.2 |
-361.3 |
| 306 |
Energy Transfer Equity
|
7,859.1 |
107.1 |
| 307 |
Dillard's
|
7,849.4 |
245.6 |
| 308 |
Boston Scientific
|
7,821.0 |
-3,577.0 |
| 309 |
Sherwin-Williams
|
7,809.8 |
576.1 |
| 310 |
Starbucks
|
7,786.9 |
564.3 |
| 311 |
Campbell Soup
|
7,778.0 |
766.0 |
| 312 |
Regions Financial
|
7,756.4 |
1,353.1 |
| 313 |
Coventry Health Care
|
7,733.8 |
560.0 |
| 314 |
Terex
|
7,647.6 |
399.9 |
| 315 |
MGM Mirage
|
7,588.0 |
648.3 |
| 316 |
Commercial Metals
|
7,555.9 |
356.3 |
| 317 |
Qualcomm
|
7,526.0 |
2,470.0 |
| 318 |
Owens-Illinois
|
7,523.5 |
-27.5 |
| 319 |
KeyCorp
|
7,507.0 |
1,055.0 |
| 320 |
NiSource
|
7,495.9 |
282.2 |
| 321 |
Eastman Chemical
|
7,450.0 |
409.0 |
| 322 |
Jacobs Engineering Grp.
|
7,421.3 |
196.9 |
| 323 |
Monsanto
|
7,344.0 |
689.0 |
| 324 |
Smith International
|
7,333.6 |
502.0 |
| 325 |
Chesapeake Energy
|
7,325.6 |
2,003.3 |
| 326 |
KeySpan
|
7,181.6 |
434.2 |
| 327 |
Dover
|
7,179.6 |
561.8 |
| 328 |
Crown Holdings
|
7,140.0 |
309.0 |
| 329 |
Land O'Lakes
|
7,102.3 |
88.7 |
| 330 |
Clear Channel Communications
|
7,099.4 |
691.5 |
| 331 |
First Data
|
7,076.4 |
1,513.4 |
| 332 |
VF
|
7,033.5 |
533.5 |
| 333 |
National Oilwell Varco
|
7,025.8 |
684.0 |
| 334 |
Integrys Energy Group
|
6,979.2 |
155.8 |
| 335 |
CIT Group
|
6,927.7 |
1,046.0 |
| 336 |
PPL
|
6,904.0 |
865.0 |
| 337 |
Northeast Utilities
|
6,897.4 |
470.6 |
| 338 |
American Family Ins. Grp.
|
6,893.1 |
24.4 |
| 339 |
Ameren
|
6,880.0 |
547.0 |
| 340 |
Liberty Global
|
6,812.9 |
706.2 |
| 341 |
CMS Energy
|
6,810.0 |
-79.0 |
| 342 |
CDW
|
6,785.5 |
266.1 |
| 343 |
Newell Rubbermaid
|
6,709.5 |
385.0 |
| 344 |
Calpine
|
6,705.8 |
-1,764.9 |
| 345 |
IAC/InterActiveCorp
|
6,684.2 |
192.6 |
| 346 |
Celanese
|
6,668.0 |
406.0 |
| 347 |
Virgin Media
|
6,637.4 |
-983.8 |
| 348 |
Ball
|
6,621.5 |
329.6 |
| 349 |
C.H. Robinson Worldwide
|
6,556.2 |
266.9 |
| 350 |
MeadWestvaco
|
6,530.0 |
93.0 |
| 351 |
Enbridge Energy Partners
|
6,509.0 |
284.9 |
| 352 |
Est�e Lauder
|
6,508.9 |
244.2 |
| 353 |
Omnicare
|
6,493.0 |
183.6 |
| 354 |
Realogy
|
6,492.0 |
365.0 |
| 355 |
Owens Corning
|
6,461.0 |
8,075.0 |
| 356 |
Black & Decker
|
6,447.3 |
486.1 |
| 357 |
Yahoo
|
6,425.7 |
751.4 |
| 358 |
Mellon Financial Corp.
|
6,395.0 |
898.0 |
| 359 |
Family Dollar Stores
|
6,394.8 |
195.1 |
| 360 |
Synnex
|
6,343.5 |
51.4 |
| 361 |
Federal-Mogul
|
6,326.4 |
-549.6 |
| 362 |
Ryder System
|
6,306.6 |
249.0 |
| 363 |
Safeco
|
6,289.9 |
880.0 |
| 364 |
Quest Diagnostics
|
6,272.3 |
586.4 |
| 365 |
CarMax
|
6,260.0 |
148.1 |
| 366 |
McGraw-Hill
|
6,255.1 |
882.2 |
| 367 |
Dole Food
|
6,219.3 |
-89.0 |
| 368 |
Interpublic Group
|
6,190.8 |
-31.7 |
| 369 |
Harley-Davidson
|
6,185.6 |
1,043.2 |
| 370 |
Thrivent Financial for Lutherans
|
6,164.6 |
548.5 |
| 371 |
NVR
|
6,156.8 |
587.4 |
| 372 |
Atmos Energy
|
6,152.4 |
147.7 |
| 373 |
Hovnanian Enterprises
|
6,148.2 |
149.5 |
| 374 |
NCR
|
6,142.0 |
382.0 |
| 375 |
Toll Brothers
|
6,123.5 |
687.2 |
| 376 |
Autoliv
|
6,118.0 |
402.3 |
| 377 |
Group 1 Automotive
|
6,083.5 |
88.4 |
| 378 |
AK Steel Holding
|
6,069.0 |
12.0 |
| 379 |
Allied Waste Industries
|
6,028.8 |
160.9 |
| 380 |
Cablevision Systems
|
6,006.7 |
-126.5 |
| 381 |
Starwood Hotels & Rsrts.
|
5,979.0 |
1,043.0 |
| 382 |
Brunswick
|
5,971.3 |
133.9 |
| 383 |
eBay
|
5,969.7 |
1,125.6 |
| 384 |
AutoZone
|
5,948.4 |
569.3 |
| 385 |
Ryerson
|
5,908.9 |
71.8 |
| 386 |
Molson Coors Brewing
|
5,902.8 |
361.0 |
| 387 |
Agilent Technologies
|
5,891.0 |
3,307.0 |
| 388 |
W.W. Grainger
|
5,883.7 |
383.4 |
| 389 |
Charles Schwab
|
5,880.0 |
1,227.0 |
| 390 |
Goodrich
|
5,878.3 |
482.1 |
| 391 |
Asbury Automotive Group
|
5,863.1 |
60.7 |
| 392 |
Becton Dickinson
|
5,834.8 |
752.3 |
| 393 |
Performance Food Group
|
5,826.7 |
42.8 |
| 394 |
NRG Energy
|
5,812.0 |
621.0 |
| 395 |
Pitney Bowes
|
5,811.2 |
105.3 |
| 396 |
USG
|
5,810.0 |
288.0 |
| 397 |
Bed Bath & Beyond
|
5,809.6 |
572.8 |
| 398 |
Freeport-McMoRan Cpr. & Gld
|
5,790.5 |
1,456.5 |
| 399 |
Boise Cascade Holdings
|
5,779.9 |
71.6 |
| 400 |
Unisys
|
5,757.2 |
-278.7 |
From the April 30th, 2007 issue
|
| Most profitable companies |
| Fortune 500 methodology |
| Included in the survey are U.S. incorporated companies filing financial statements with a government agency. This includes private companies... (more)
|
|